


Collegedunia Team Content Curator
Content Curator
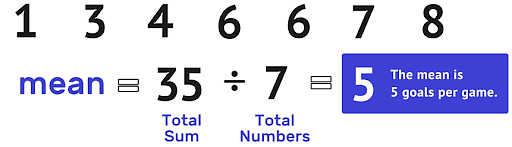
Mean of a data set can be calculated by dividing the sum of all data points with the total number of data points in the set. To put it simply, the mean is the arithmetic average of all data points. It is one of the most popular methods used in statistical analysis of data. Mean refers to a quantitative notion that has a lot of meaning in finance and is utilized in various financial areas and company valuation. There are three statistical measures of the central tendency of data, which are mean, median, and mode.
| Table of Content |
What is Mean in Statistics?
Mean of a data set is derived by dividing all data points by the number of data points in the data set. It's a data point in a collection that represents the aggregate of all the pieces of data in the set. The mean is the most popular and widely used statistical approach for determining the center of a data set. It is a basic but necessary aspect of data analysis of statistics. For example, the population mean is the result which we obtain as the average value of a population set. Occasionally, population statistics are so huge that we cannot do any kind of analysis on it. As a result, in that situation, we collect samples and aggregate them. That sample symbolizes the community, and the sample mean the average of this subset of the data.
Mean = Sum of observations / Number of observations
Note: The average value of a data collection is the value that lies between the lower and upper limits. The average value will not be the same as the data set's value, but it's readings are often the same.
Properties of Mean
- When all elements have the same gap (and the quantity of elements is odd), the mean equals the mid-term. The mean of the beginning and last terms is likewise the average of the sequence's terms.
- When x is multiplied by all of the components, the mean rises by x.
- When you subtract x from all of the things, the mean falls by x.
- If each item is multiplied by x, the mean is multiplied by x as well.
- If each item is divided by x, the mean is divided by x as well.
Real-Life Instances of Mean
In actual life, an example of mean is –
- The mean of a cricketer's runs scored in test series
- Real estate brokers assess the average property prices in a given area.
Mean Formula for Ungrouped Data
The method of calculating the average of data that are ungrouped is as follows:
If there are n samples in a data collection with x1, x2, x3, …, xn, the average of these numbers are: =
∑xi / n
Here,
n = Number of observations
xi = ith observation, 1 ≤ i ≤ n
∑xi = Sum of observations
Mean Formula for Grouped Data
Depending on the quantity of the data, there are three methods for calculating the mean for grouped data. They are as follows:
- Direct Method
- Assumed Mean Method
- Step-deviation Method
Direct Method
Direct method is the most basic way to calculate the mean of grouped data. The procedures for utilizing the direct technique to obtain the mean for grouped data are outlined below.
Make a table with four columns, as shown below.
- Column 1 - Interval between classes.
- Column 2 - Corresponding class marks, marked by xi.
- Column 3 - Frequencies (fi) in (corresponding)
- Column 4 - xifi (corresponding product of column 2 and column 3)
Determine the mean using the Formula = ∑xifi/∑fi
Assume that x1, x2, x3...., xn are n measurements, each with a frequency of f1, f2, f3,...., fn. This means that x1 happens f1 times, x2 happens f2 times, x3 happens f3 times, and so on. As a result, the direct method's mean calculation formula is:
x = (f1x1 + f2x2 + f3x3 + …. + fnxn) / (f1+f2+f3+…. +fn)
Or
x = (∑n i = 1 fixi) / (∑n i = 1 fi)
Here,
- ∑fixi = total number of samples
- ∑fi = Frequency or observation total
When the number of samples is small, the direct mean method is utilized.
Assumed Mean Method
When the direct technique becomes too time-consuming, we use the assumed mean method to calculate the average of a set of grouped data. We can use the assumed mean method to detect and calculate the mean by following the procedures listed below.
Make a table using the five columns listed below.
- Column 1: Interval between classes.
- Column 2: Classmarks (correlating), represented by xi. Assumed Mean A: Pick the median value from the class marks and indicate it as A.
- Column 3: Determine the relevant deviations using the formula di = xi - A.
- Column 4: Frequencies (fi) (corresponding)
- Column 5: Mean of di = ∑xidi/∑di
Finally, calculate the Mean by adding the assumed mean to the average of the di.
We usually assume a value as the average in this manner (namely, a). This value is used to calculate the deviations that the formula is based on. In addition, the information will be presented as a frequency distribution table with classifications. As a result, the formula for calculating the mean using the assumed mean technique is:
Mean (x) = A + ∑fidi / ∑fi
Here,
- fi = ith class’s frequency
- A = assumed mean
- Σfi = N = Total number of samples
- di = xi – A = ith class’s deviation
- xi = class mark = (higher class limit + lower class limit)/2
The video below explains this:
Assumed Mean Method Detailed Video Explanation:
Step-Deviation Method
The shift of origin and scale method are other names for step deviation. When calculating the mean for grouped data, we use the step deviation approach to simplify the calculations. The following are the steps to take while using the step deviation method:
Make a table with five columns, as shown below.
- Column 1: Interval between classes.
- Column 2: Interval between classes. Classmarks (corresponding), represented by xi. Assumed Mean A: Take the median value from the class marks and indicate it as A.
- Column 3: Determine the corresponding deviations using the formula di = xi – A.
- Column 4: Use the formula ui = di/h to calculate the values of ui, where h is the class width.
- Column 5: Frequencies (fi) (corresponding)
Lastly, add the assumed mean A to the product of class width(h) and mean of ui to get the Mean.
The step-deviation method can be used to find the mean when the data values are large. The formula is as follows:
Mean (¯x) = A + (h∑fiui / ∑fi)
Here,
- fi = ith class’s frequency
- A = assumed mean
- ui = (xi – a)/h
- xi – a = ith class’s deviation
- xi = class mark = (higher class limit + lower class limit)/2
- Σfi = N = Total number of samples
Sample Questions
Ques: Calculate the mean of the data set below. (3 marks)
15, 29, 34, 17, 31, 40, 37, 32, 30, 45
Ans:- Given,
xi = 15, 29, 34, 17, 31, 40, 37, 32, 30, 45
n = 10
Mean = ∑xi / n
= (15 + 29 + 34 + 17 + 31 + 40 + 37 + 32 + 30 + 45) / 10
= 307/10
= 30.7
Ques: Find the mean of the given distribution, which contains the students' exam grades. (5 marks)
| Grades | 37 | 89 | 58 | 98 | 70 | 15 | 66 | 35 |
|---|---|---|---|---|---|---|---|---|
| No. of students | 3 | 9 | 5 | 1 | 19 | 20 | 36 | 7 |
Ans: Let's make a table to figure out the total:
| Marks (xi) | No. of students (fi) | fixi |
|---|---|---|
| 37 | 3 | 111 |
| 89 | 9 | 801 |
| 58 | 5 | 290 |
| 98 | 1 | 98 |
| 70 | 19 | 1330 |
| 15 | 20 | 300 |
| 66 | 36 | 2376 |
| 35 | 7 | 245 |
| Sum | 100 | 5551 |
Mean = (∑fixi)/ ∑fi
= 5551/100
= 55.51
Thus, the average of the provided distribution is 55.51.
Ques: The results of a test taken by 150 students are shown in the table below.
| Class | 0-10 | 10-20 | 20-30 | 30-40 | 40-50 |
|---|---|---|---|---|---|
| Frequency | 29 | 34 | 23 | 26 | 38 |
Using the assumed mean method, determine the students' mean grades. (5 marks)
Ans:To calculate xi, di, and fidi, we'll make a table.
| Class (CI) | Frequency (fi) | Class mark (xi) | di = xi – a | fidi |
|---|---|---|---|---|
| 0-10 | 29 | 5 | 5 – 25 = – 20 | -580 |
| 10-20 | 34 | 15 | 15 – 25 = – 10 | -340 |
| 20-30 | 23 | 25 = a | 25-25 = 0 | 0 |
| 30-40 | 26 | 35 | 35-25 = 10 | 260 |
| 40-50 | 38 | 45 | 45-25 = 20 | 760 |
| Total | Σfi =150 | Σfidi = -100 |
Assumed mean = a = 25
Mean of the data:
= a + (∑fidi / fi)
= 25 + (-100 / 150)
= 25 - (1 / 15)
= (375-1) / 15
= 374 / 15
=23.375
Hence, the mean marks of the students = 23.375.
Ques: The new mean is 53.375 when a number x is added to the data set 9, 56, 23, 78, 63, 12, 99. Calculate the value of x. (4 marks)
Ans: There are 8 numerals in the set, including x. Create an equation to calculate the mean when the value is unknown.
(9 + 56 + 23 + 78 + 63 + 12 + 99 + x) / 8 = 53.375
Simplify.
(340 + x) / 8 = 53.375
Multiply both sides by 8.
340 + x = 427
Subtract 340 from both sides.
x = 87
Ques: Aisha received 87, 81, 92, and 93 on his first four Literature tests. She requires a grade of 90 or above in order to receive an A in the class. To achieve an A, she needs to get a certain score on the fifth test. What should that be? (4 marks)
Ans: Let x be the required score on the fifth test. Write an equation for calculating the mean with the unknown value.
(87 + 81 + 92 + 93 + x) / 5 = 90
Simplify.
(353 + x) / 5=90
Multiply both sides by 5.
353 + x = 450
Subtract 353 from both sides.
x = 97
To receive an A, she must achieve a score of 97 or better.
Ques: In a basketball club, there are 100 members. The members' various age categories, as well as the number of members in each age group, are listed below. Calculate the average age of the members of the club. (5 marks)
| Age Group | Number of members |
|---|---|
| 10-20 | 20 |
| 20-30 | 20 |
| 30-40 | 21 |
| 40-50 | 22 |
| 50-60 | 17 |
Ans: We must first compute the Class Mark for every age group in this situation.
We'll compute the Class Mark for every age category using the method underneath.
(Higher Limit + Lower Limit)/2 = Class Mark
| Age Group | Class Mark | Number of members |
|---|---|---|
| 10-20 | 15 | 20 |
| 20-30 | 25 | 20 |
| 30-40 | 35 | 21 |
| 40-50 | 45 | 22 |
| 50-60 | 55 | 17 |
Now,
x1 = 15, x2= 25, x3 = 35, x4= 45, x5 = 55
f1 = 20, f2 = 20, f3 = 21, f4 = 22, f5 = 17
x1f1 =15 × 20 = 300
x2f2 = 25 × 20 = 500
x3f3 = 35 × 21 = 735
x4f4 = 45 × 22 = 990
x5f5 = 55 × 17 =935
f1x1 + f2x2 + f3x3 + f4x4 + f5x5 = 300 + 500 + 735 + 990 + 935 = 3460
f1 + f2 + f3 + f4 + f5 = 20 + 20 + 21 + 22 + 17 = 100
We will use the formula given below.
x? = Σfixi / Σfi
The mean age = 3460/100
= 34.6
The mean age of the members = 34.6
Ques: A group of 25 pupils has an average score of 85. Two more pupils were added to the group, with scores of 86 and 95. What is the revised average of the pupils' group? (5 marks)
Ans: The formula of the mean is
Mean = total scores / number of pupils
This formula can also be written as -
Total scores = mean x number of pupils
Original score = 85 x 25 = 2125
After the addition of two new pupils, the score is
2125 + 86 +95 = 2306
The new total number of pupils is
25 + 2 = 27
the new mean of the group of pupils is
Mean = Total scores / number of pupils
Mean = 2306 / 27
Mean = 85.40


Comments