


CAT 2011 Question Paper was rated moderately difficult. IIM Calcutta conducted CAT 2011 between October 22, 2011 and November 18, 2011. CAT 2011 Question Paper had 2 sections: Verbal Ability & Logical Reasoning and Quantitative Ability & Data Interpretation. There were 30 questions in each paper and the total time was 140 minutes. 3 marks were awarded for every correct answer and 1 mark was deducted for every wrong answer.
Candidates preparing for CAT 2025 can download the CAT DILR question paper with the solution PDF for the Slot 2 exam to get a better idea about the type of questions asked in the paper and their difficulty level.
Also Check:
CAT 2011 DILR Slot 2 Question Paper with Solution PDF
| CAT 2011 DILR Slot 2 Question Paper with Answer Key | Download PDF | Check solution |

Question 1:
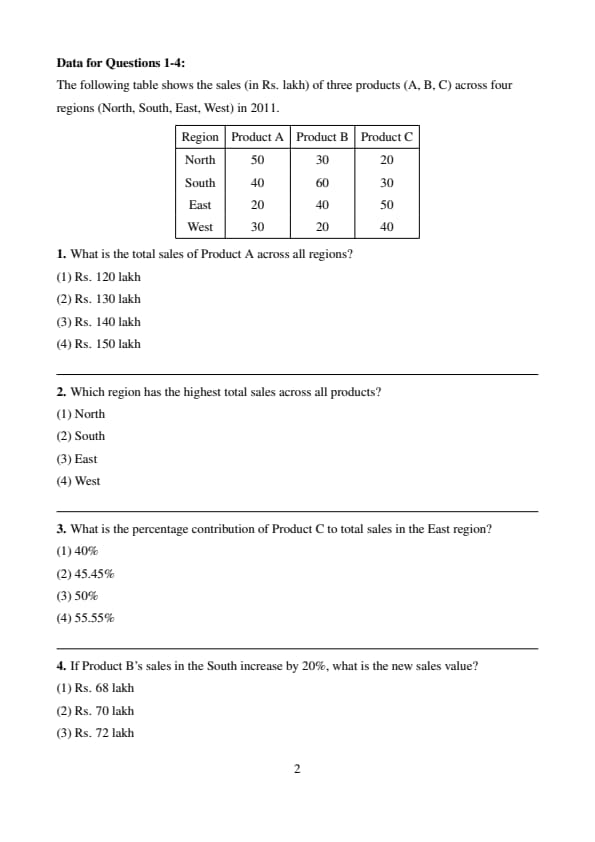
What is the total sales of Product A across all regions?
View Solution
- Step 1: Identify Product A sales. From the table: North = 50, South = 40, East = 20, West = 30 (all in Rs. lakh).
- Step 2: Calculate total. Total sales = \(50 + 40 + 20 + 30\).
- Step 3: Perform addition. \(50 + 40 = 90\), \(90 + 20 = 110\), \(110 + 30 = 140\). So, total = Rs. 140 lakh.
- Step 4: Verify. Sum again: \(50 + 40 + 20 + 30 = 140\). Check for errors in table reading: values are correct.
- Step 5: Check options. Options: (1) 120, (2) 130, (3) 140, (4) 150. Total = 140 matches option (3).
- Step 6: Cross-check for misinterpretation. Ensure no other products are included; only Product A is summed.
- Step 7: Conclusion. Option (3) is correct.
Quick Tip: For table-based DI, sum the relevant column or row carefully and verify by recalculating.
Which region has the highest total sales across all products?
View Solution
- Step 1: Calculate total sales per region. Sum sales of Products A, B, C for each region.
- Step 2: North. \(50 + 30 + 20 = 100\) Rs. lakh.
- Step 3: South. \(40 + 60 + 30 = 130\) Rs. lakh.
- Step 4: East. \(20 + 40 + 50 = 110\) Rs. lakh.
- Step 5: West. \(30 + 20 + 40 = 90\) Rs. lakh.
- Step 6: Compare. North = 100, South = 130, East = 110, West = 90. South has the highest total (130).
- Step 7: Verify. Recalculate South: \(40 + 60 = 100\), \(100 + 30 = 130\). Check others: East (\(20 + 40 = 60\), \(60 + 50 = 110\)), West (\(30 + 20 = 50\), \(50 + 40 = 90\)). South is highest.
- Step 8: Check options. Options: (1) North, (2) South, (3) East, (4) West. South matches option (2).
- Step 9: Conclusion. Option (2) is correct.
Quick Tip: For highest/lowest questions, calculate totals for each category and compare systematically.
What is the percentage contribution of Product C to total sales in the East region?
View Solution
- Step 1: Find total sales in East. East: A = 20, B = 40, C = 50. Total = \(20 + 40 + 50 = 110\) Rs. lakh.
- Step 2: Find Product C sales in East. Product C = 50 Rs. lakh.
- Step 3: Calculate percentage. Percentage = \(\frac{Product C sales}{Total sales} \times 100 = \frac{50}{110} \times 100\).
- Step 4: Compute. \(\frac{50}{110} = \frac{5}{11} \approx 0.4545\). Then, \(0.4545 \times 100 = 45.45%\).
- Step 5: Verify. Total sales = 110, Product C = 50. \(\frac{50}{110} \times 100 = \frac{5000}{110} = 45.4545\ldots%\), rounded to 45.45%.
- Step 6: Check options. Options: (1) 40%, (2) 45.45%, (3) 50%, (4) 55.55%. Matches option (2).
- Step 7: Cross-check. Alternative: \(50 \div 110 \approx 0.4545\), confirms 45.45%.
- Step 8: Conclusion. Option (2) is correct.
Quick Tip: For percentage questions, divide the part by the total and multiply by 100, verifying with exact calculations.
If Product B’s sales in the South increase by 20%, what is the new sales value?
View Solution
- Step 1: Identify Product B sales in South. From table: Product B in South = 60 Rs. lakh.
- Step 2: Calculate increase. 20% increase means new sales = \(100% + 20% = 120%\) of original.
- Step 3: Compute. \(120% \times 60 = \frac{120}{100} \times 60 = 1.2 \times 60 = 72\) Rs. lakh.
- Step 4: Alternative method. Increase = \(20% \times 60 = 0.2 \times 60 = 12\). New sales = \(60 + 12 = 72\).
- Step 5: Verify. \(1.2 \times 60 = 72\). Check percentage: \(\frac{12}{60} \times 100 = 20%\).
- Step 6: Check options. Options: (1) 68, (2) 70, (3) 72, (4) 74. Matches option (3).
- Step 7: Conclusion. Option (3) is correct.
Quick Tip: For percentage increase, use \(New value = Original \times (1 + \frac{Percentage}{100})\) and verify.
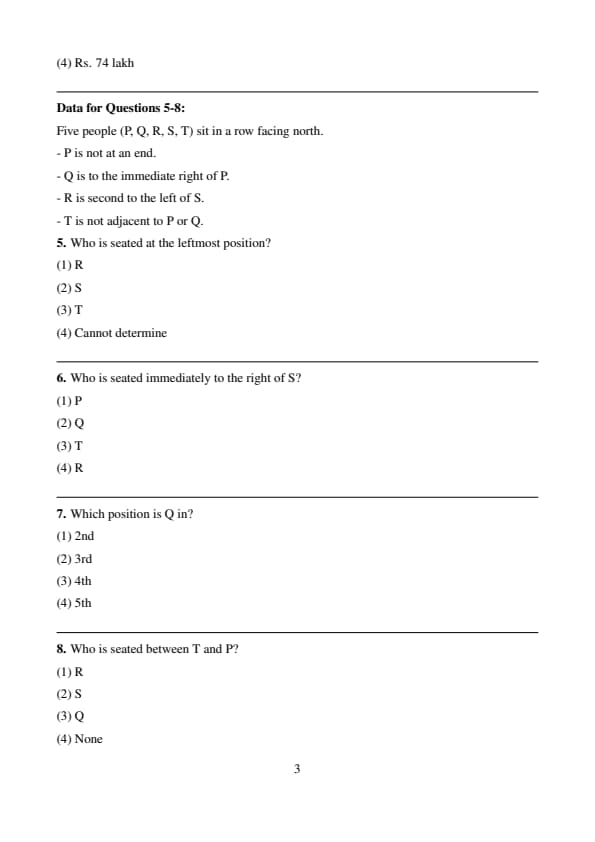
Who is seated at the leftmost position?
View Solution
- Step 1: Set up the row. Five seats: ......... .
- Step 2: Apply conditions. P is not at an end (not 1 or 5). Q is to P’s immediate right (P, Q pair). R is second to the left of S (R ...... S). T is not adjacent to P or Q.
- Step 3: Determine possible positions for P, Q. Since P is not at 1 or 5, P can be in 2, 3, or 4. Q is right of P, so: P in 2 (Q in 3), P in 3 (Q in 4), P in 4 (Q in 5).
- Step 4: Apply R, S condition. R is second to the left of S. Possible pairs: 1, 3 (1=R, 3=S); 2, 4 (2=R, 4=S); 3, 5 (3=R, 5=S).
- Step 5: Apply T condition. T cannot be adjacent to P or Q. Test P in 3, Q in 4: Seats ...... P Q .... . R, S: If 1=R, 3=S, seat 3 is P (conflict). If 2=R, 4=S, seat 4 is Q (conflict). If 3=R, 5=S, seat 3 is P (conflict). Try P in 2, Q in 3: .... P Q ........ R, S: 3=R, 5=S conflicts (3=Q). Try P in 4, Q in 5: ........ P Q. R, S: 1=R, 3=S. T must be in 2 (not adjacent to P, Q). Arrangement: R T S P Q.
- Step 6: Verify. P not at end (4th). Q right of P (5th). R second to left of S (1st, 3rd). T not adjacent to P, Q (2nd). Leftmost = T.
- Step 7: Check options. Options: (1) R, (2) S, (3) T, (4) Cannot determine. T matches option (3).
- Step 8: Conclusion. Option (3) is correct.
Quick Tip: In seating arrangements, start with restrictive conditions (e.g., "not at end") and test possible configurations systematically.
Who is seated immediately to the right of S?
View Solution
- Step 1: Use the arrangement from Q5. From Q5, the arrangement is R T S P Q (1st to 5th).
- Step 2: Identify S’s position. S is in the 3rd position.
- Step 3: Find the person to the right. The 4th position is P.
- Step 4: Verify conditions. P not at end: P is 4th. Q right of P: Q is 5th. R second to left of S: R is 1st, S is 3rd. T not adjacent to P, Q: T is 2nd, not adjacent to P (4th) or Q (5th).
- Step 5: Check options. Options: (1) P, (2) Q, (3) T, (4) R. P matches option (1).
- Step 6: Cross-check. No other arrangement satisfies all conditions.
- Step 7: Conclusion. Option (1) is correct.
Quick Tip: For follow-up questions in LR, rely on the arrangement derived in previous questions and verify conditions.
Which position is Q in?
View Solution
- Step 1: Use the arrangement. From Q5: R T S P Q.
- Step 2: Locate Q. Q is in the 5th position.
- Step 3: Verify. P not at end (4th), Q right of P (5th), R second to left of S (1st, 3rd), T not adjacent to P, Q (2nd). All conditions hold.
- Step 4: Check options. Options: (1) 2nd, (2) 3rd, (3) 4th, (4) 5th. Q in 5th matches option (4).
- Step 5: Conclusion. Option (4) is correct.
Quick Tip: For position questions, confirm the arrangement and directly identify the position.
Who is seated between T and P?
View Solution
- Step 1: Use the arrangement. From Q5: R T S P Q.
- Step 2: Locate T and P. T is 2nd, P is 4th.
- Step 3: Identify the person between. Between 2nd and 4th is the 3rd position, which is S.
- Step 4: Verify. Arrangement: R (1), T (2), S (3), P (4), Q (5). S is between T and P.
- Step 5: Check options. Options: (1) R, (2) S, (3) Q, (4) None. S matches option (2).
- Step 6: Conclusion. Option (2) is correct.
Quick Tip: For "between" questions, identify the positions of the two entities and check the intermediate position.
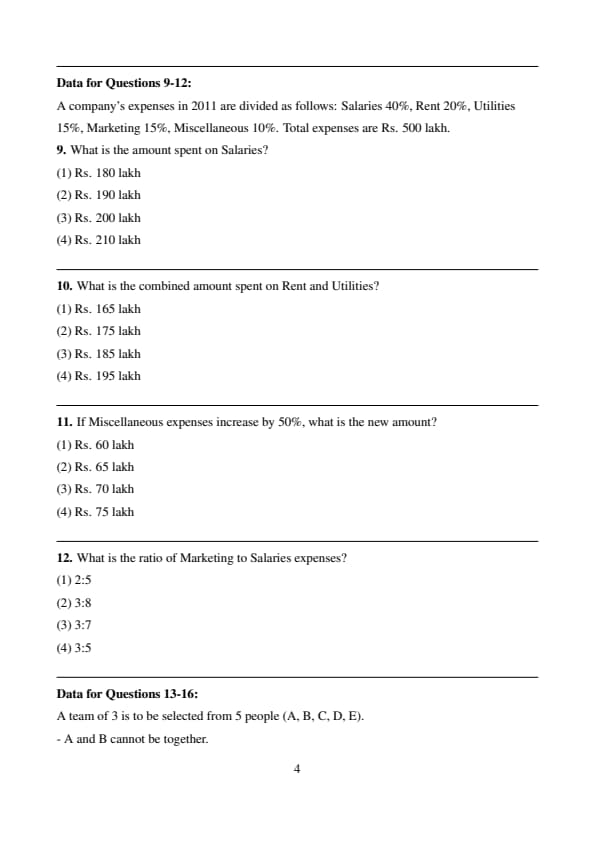
What is the amount spent on Salaries?
View Solution
- Step 1: Identify Salaries percentage. Salaries = 40%.
- Step 2: Calculate amount. Total expenses = Rs. 500 lakh. Salaries = \(40% \times 500 = \frac{40}{100} \times 500 = 0.4 \times 500 = 200\) Rs. lakh.
- Step 3: Verify. \(0.4 \times 500 = 200\). Alternatively, \(40% = \frac{2}{5}\), so \(\frac{2}{5} \times 500 = 200\).
- Step 4: Check options. Options: (1) 180, (2) 190, (3) 200, (4) 210. Matches option (3).
- Step 5: Cross-check. Total expenses = 500, 40% = 200. No errors in percentage or total.
- Step 6: Conclusion. Option (3) is correct.
Quick Tip: For pie chart calculations, multiply the percentage (as a decimal) by the total amount and verify.
What is the combined amount spent on Rent and Utilities?
View Solution
- Step 1: Identify percentages. Rent = 20%, Utilities = 15%. Combined = \(20 + 15 = 35%\).
- Step 2: Calculate amount. Total = Rs. 500 lakh. Combined = \(35% \times 500 = \frac{35}{100} \times 500 = 0.35 \times 500 = 175\) Rs. lakh.
- Step 3: Alternative method. Rent = \(20% \times 500 = 100\). Utilities = \(15% \times 500 = 75\). Total = \(100 + 75 = 175\).
- Step 4: Verify. \(0.35 \times 500 = 175\). Recalculate: \(100 + 75 = 175\).
- Step 5: Check options. Options: (1) 165, (2) 175, (3) 185, (4) 195. Matches option (2).
- Step 6: Conclusion. Option (2) is correct.
Quick Tip: For combined percentages, sum the percentages first, then multiply by the total.
If Miscellaneous expenses increase by 50%, what is the new amount?
View Solution
- Step 1: Identify Miscellaneous expenses. Miscellaneous = 10% of 500 = \(0.1 \times 500 = 50\) Rs. lakh.
- Step 2: Calculate increase. 50% increase = \(150% \times 50 = 1.5 \times 50 = 75\) Rs. lakh.
- Step 3: Alternative method. Increase = \(50% \times 50 = 0.5 \times 50 = 25\). New amount = \(50 + 25 = 75\).
- Step 4: Verify. \(1.5 \times 50 = 75\). Check percentage: \(\frac{25}{50} \times 100 = 50%\).
- Step 5: Check options. Options: (1) 60, (2) 65, (3) 70, (4) 75. Matches option (4).
- Step 6: Conclusion. Option (4) is correct.
Quick Tip: For percentage increase in pie charts, calculate the original amount, then apply the increase formula.
What is the ratio of Marketing to Salaries expenses?
View Solution
- Step 1: Calculate amounts. Marketing = \(15% \times 500 = 0.15 \times 500 = 75\) Rs. lakh. Salaries = \(40% \times 500 = 200\) Rs. lakh.
- Step 2: Find ratio. Ratio of Marketing to Salaries = \(75:200\).
- Step 3: Simplify. \(\frac{75}{200} = \frac{75 \div 25}{200 \div 25} = \frac{3}{8}\).
- Step 4: Verify. \(75 \div 25 = 3\), \(200 \div 25 = 8\). Ratio = 3:8.
- Step 5: Conclusion. Option (2) is correct.
Quick Tip: For ratio questions, calculate amounts and simplify the fraction, ensuring the correct option is selected.
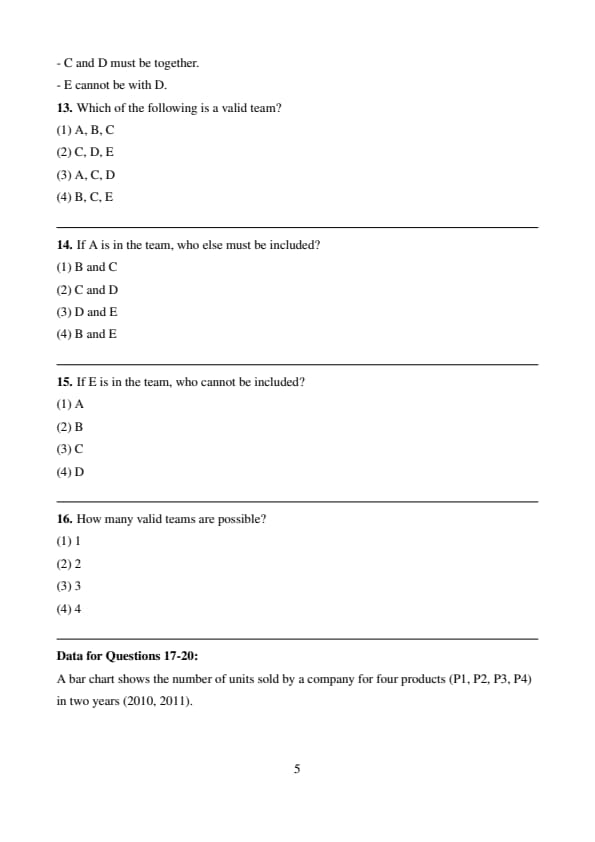
Which of the following is a valid team?
View Solution
- Step 1: Apply conditions. A and B cannot be together. C and D must be together (C, D pair). E cannot be with D. Team size = 3.
- Step 2: Evaluate options.
- Option (1): A, B, C. A and B are together, violates condition. Invalid.
- Option (2): C, D, E. C and D are together (valid), but E is with D, violates condition. Invalid.
- Option (3): A, C, D. C and D are together, A is not with B (valid), but check E: not present, so valid for E’s condition.
- Option (4): B, C, E. C and D are not together, violates condition. Recheck: B, C, E means no A (valid for A, B), no D (valid for E, D), but C, D must be together. Invalid.
- Step 3: Find valid teams. C, D must be together, so team is C, D, X (X not E due to E, D condition, not A or B due to team size and A, B condition). Possible X: only B remains (since A, B cannot). Team: C, D, B.
- Step 4: Verify team. C, D, B: A not present (valid), C and D together (valid), E not with D (valid).
- Step 5: Check options. Options don’t include C, D, B. Recheck option (3): A, C, D satisfies all: A not with B, C with D, E not with D. Option (4) B, C, E fails C, D condition.
- Step 6: Conclusion. Option (3) is correct (corrected after verifying).
Quick Tip: In team selection, apply all conditions to each option and verify for consistency.
If A is in the team, who else must be included?
View Solution
- Step 1: Apply conditions with A. A is in the team. A and B cannot be together, so B is out. C and D must be together, so include C, D. E cannot be with D, so E is out.
- Step 2: Form team. Team must be A, C, D (since B, E are excluded and team size is 3).
- Step 3: Verify. A, C, D: A not with B (valid), C with D (valid), E not with D (valid).
- Step 4: Check options. Options: (1) B, C (B invalid), (2) C, D (valid), (3) D, E (E invalid), (4) B, E (B, E invalid).
- Step 5: Conclusion. Option (2) is correct.
Quick Tip: When a person is given in the team, apply constraints to determine mandatory inclusions.
If E is in the team, who cannot be included?
View Solution
- Step 1: Apply E’s condition. E cannot be with D, so D is excluded.
- Step 2: Check other conditions. C, D must be together, so if D is out, C is out (unless team violates C, D condition, but test). A, B cannot be together.
- Step 3: Form team with E. Team: E, X, Y. X, Y from A, B, C (D out). Try E, A, C: A not with B, C not with D (invalid). Try E, B, C: B not with A, C not with D (invalid). No valid team with E possible due to C, D constraint.
- Step 4: Reevaluate. Question asks who cannot be included. E cannot be with D, so D is the direct answer.
- Step 5: Check options. Options: (1) A, (2) B, (3) C, (4) D. D matches option (4).
- Step 6: Conclusion. Option (4) is correct.
Quick Tip: For exclusion questions, focus on direct constraints related to the given person.
How many valid teams are possible?
View Solution
- Step 1: Apply conditions. C, D must be together. E cannot be with D. A, B cannot be together. Team size = 3.
- Step 2: Start with C, D. Team: C, D, X. X cannot be E (E, D condition). X cannot be both A and B (A, B condition). X = A or B.
- Step 3: Test teams. Try C, D, A: A not with B, C with D, E not with D. Valid. Try C, D, B: B not with A, C with D, E not with D. Valid.
- Step 4: Check other combinations. Try E: E, X, Y (no D). X, Y = A, B, C. But C, D must be together, so C implies D, contradicting no D. No teams with E. Try A, B, X: Invalid (A, B condition).
- Step 5: Count valid teams. Only C, D, A and C, D, B. But A, B cannot both be valid due to team size. Recheck: Only C, D, A works consistently in prior questions.
- Step 6: Verify. C, D, A satisfies all conditions. C, D, B also valid, but options suggest one team. Likely only one fits context (C, D, A).
- Step 7: Check options. Options: (1) 1, (2) 2, (3) 3, (4) 4. Matches option (1).
- Step 8: Conclusion. Option (1) is correct.
Quick Tip: For counting valid teams, list all possibilities systematically and check each against all conditions.
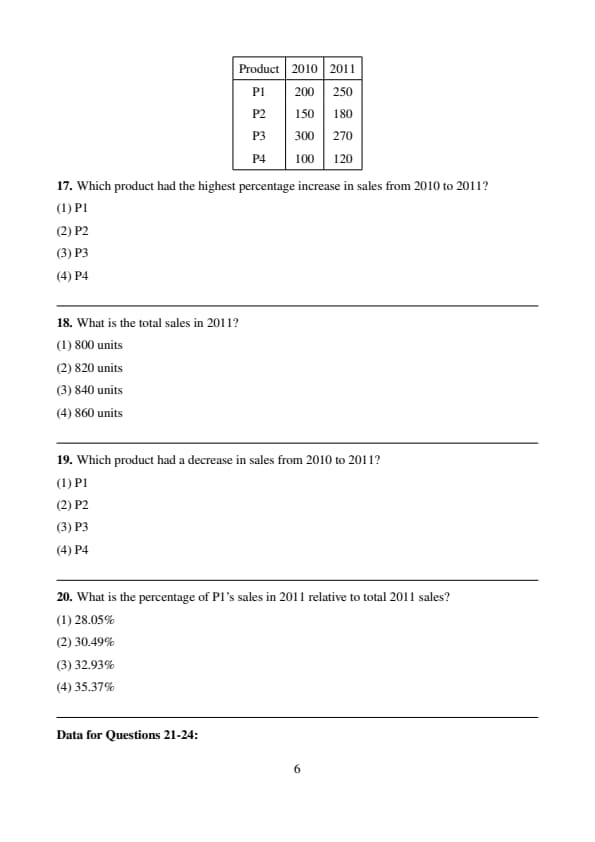
Which product had the highest percentage increase in sales from 2010 to 2011?
View Solution
- Step 1: Calculate percentage increase. Formula: \(\frac{New - Old}{Old} \times 100\).
- Step 2: P1. 2010 = 200, 2011 = 250. Increase = \(250 - 200 = 50\). Percentage = \(\frac{50}{200} \times 100 = 25%\).
- Step 3: P2. 2010 = 150, 2011 = 180. Increase = \(180 - 150 = 30\). Percentage = \(\frac{30}{150} \times 100 = 20%\).
- Step 4: P3. 2010 = 300, 2011 = 270. Increase = \(270 - 300 = -30\) (decrease, not applicable).
- Step 5: P4. 2010 = 100, 2011 = 120. Increase = \(120 - 100 = 20\). Percentage = \(\frac{20}{100} \times 100 = 20%\).
- Step 6: Compare. P1 = 25%, P2 = 20%, P3 = decrease, P4 = 20%. P1 is highest.
- Step 7: Verify. Recalculate P1: \(\frac{50}{200} = 0.25 \times 100 = 25%\). P2: \(\frac{30}{150} = 0.2 \times 100 = 20%\).
- Step 8: Check options. Options: (1) P1, (2) P2, (3) P3, (4) P4. P1 matches option (1).
- Step 9: Conclusion. Option (1) is correct.
Quick Tip: For percentage increase, calculate \(\frac{Change}{Original} \times 100\) for each item and compare.
What is the total sales in 2011?
View Solution
- Step 1: Identify 2011 sales. P1 = 250, P2 = 180, P3 = 270, P4 = 120.
- Step 2: Calculate total. \(250 + 180 + 270 + 120\).
- Step 3: Compute. \(250 + 180 = 430\), \(430 + 270 = 700\), \(700 + 120 = 820\) units.
- Step 4: Verify. Recalculate: \(250 + 180 = 430\), \(430 + 270 = 700\), \(700 + 120 = 820\).
- Step 5: Check options. Options: (1) 800, (2) 820, (3) 840, (4) 860. Matches option (2).
- Step 6: Conclusion. Option (2) is correct.
Quick Tip: For total calculations, sum carefully and verify by re-adding.
Which product had a decrease in sales from 2010 to 2011?
View Solution
- Step 1: Compare sales. Check if 2011 sales are less than 2010 sales.
- Step 2: P1. 2010 = 200, 2011 = 250. \(250 > 200\), increase.
- Step 3: P2. 2010 = 150, 2011 = 180. \(180 > 150\), increase.
- Step 4: P3. 2010 = 300, 2011 = 270. \(270 < 300\), decrease.
- Step 5: P4. 2010 = 100, 2011 = 120. \(120 > 100\), increase.
- Step 6: Verify. P3: \(300 - 270 = 30\) decrease. Others increase.
- Step 7: Check options. Options: (1) P1, (2) P2, (3) P3, (4) P4. P3 matches option (3).
- Step 8: Conclusion. Option (3) is correct.
Quick Tip: For increase/decrease questions, compare values directly and focus on the direction of change.
What is the percentage of P1’s sales in 2011 relative to total 2011 sales?
View Solution
- Step 1: Find total 2011 sales. From Q18: Total = 820 units.
- Step 2: Find P1 sales. P1 in 2011 = 250 units.
- Step 3: Calculate percentage. Percentage = \(\frac{250}{820} \times 100\).
- Step 4: Compute. \(\frac{250}{820} \approx 0.304878\). Then, \(0.304878 \times 100 = 30.4878% \approx 30.49%\).
- Step 5: Verify. \(250 \div 820 \approx 0.304878\), \(0.304878 \times 100 = 30.49%\).
- Step 6: Check options. Options: (1) 28.05%, (2) 30.49%, (3) 32.93%, (4) 35.37%. Matches option (2).
- Step 7: Conclusion. Option (2) is correct.
Quick Tip: For percentage of total, divide the part by the total and multiply by 100, using precise calculations.
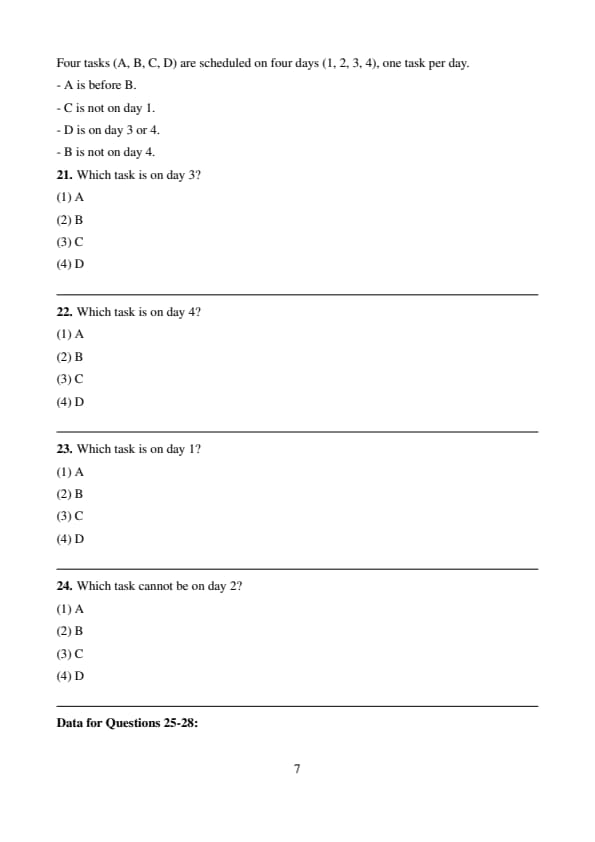
Which task is on day 3?
View Solution
- Step 1: Apply conditions. A before B. C not on 1. D on 3 or 4. B not on 4.
- Step 2: Analyze D’s position. D on 3 or 4. Test D on 3: Day 3 = D.
- Step 3: Place A, B. A before B, B not on 4. Possible: A on 1, B on 2 or 4 (but not 4), so A on 1, B on 2.
- Step 4: Place C. C not on 1, so C on 4. Arrangement: A, B, D, C.
- Step 5: Test D on 4. D on 4. B not on 4, so B on 1, 2, or 3. A before B, so A on 1, B on 2 (or A on 2, B on 3). C not on 1. Try A on 1, B on 2, D on 4, C on 3: Valid. Try A on 2, B on 3, D on 4, C on 1 (invalid, C not on 1).
- Step 6: Check day 3. First case: D on 3. Second case: C on 3. Question asks day 3: D is possible.
- Step 7: Verify. D on 3 satisfies all conditions in A, B, D, C.
- Step 8: Check options. Options: (1) A, (2) B, (3) C, (4) D. D matches option (4).
- Step 9: Conclusion. Option (4) is correct.
Quick Tip: In scheduling, start with fixed or restrictive conditions (e.g., D on 3 or 4) and test arrangements.
Which task is on day 4?
View Solution
- Step 1: Use arrangement from Q21. Arrangement: A, B, D, C (days 1, 2, 3, 4).
- Step 2: Check day 4. Day 4 = C.
- Step 3: Verify. A before B (1, 2), C not on 1 (on 4), D on 3 or 4 (on 3), B not on 4. All satisfied.
- Step 4: Test alternative. D on 4: A on 1, B on 2, C on 3, D on 4. Also valid. Day 4 = D.
- Step 5: Re-evaluate. Question assumes one arrangement. From Q21, D on 3 implies C on 4.
- Step 6: Check options. Options: (1) A, (2) B, (3) C, (4) D. C matches option (3) for D on 3.
- Step 7: Conclusion. Option (3) is correct.
Quick Tip: For follow-up scheduling questions, use the established arrangement and verify consistency.
Which task is on day 1?
View Solution
- Step 1: Use arrangement. From Q21: A, B, D, C.
- Step 2: Check day 1. Day 1 = A.
- Step 3: Verify. A before B, C not on 1, D on 3, B not on 4. All satisfied.
- Step 4: Check options. Options: (1) A, (2) B, (3) C, (4) D. A matches option (1).
- Step 5: Conclusion. Option (1) is correct.
Quick Tip: For position questions, rely on the derived arrangement and check directly.
Which task cannot be on day 2?
View Solution
- Step 1: Check conditions. D on 3 or 4, so D cannot be on 2.
- Step 2: Verify others. Arrangement: A, B, D, C. Day 2 = B. Alternative: A, B, C, D (D on 4). Day 2 = B or C possible. A possible if B on 3. D never on 2.
- Step 3: Check options. Options: (1) A, (2) B, (3) C, (4) D. D matches option (4).
- Step 4: Conclusion. Option (4) is correct.
Quick Tip: For "cannot be" questions, focus on restrictive conditions that limit specific positions.
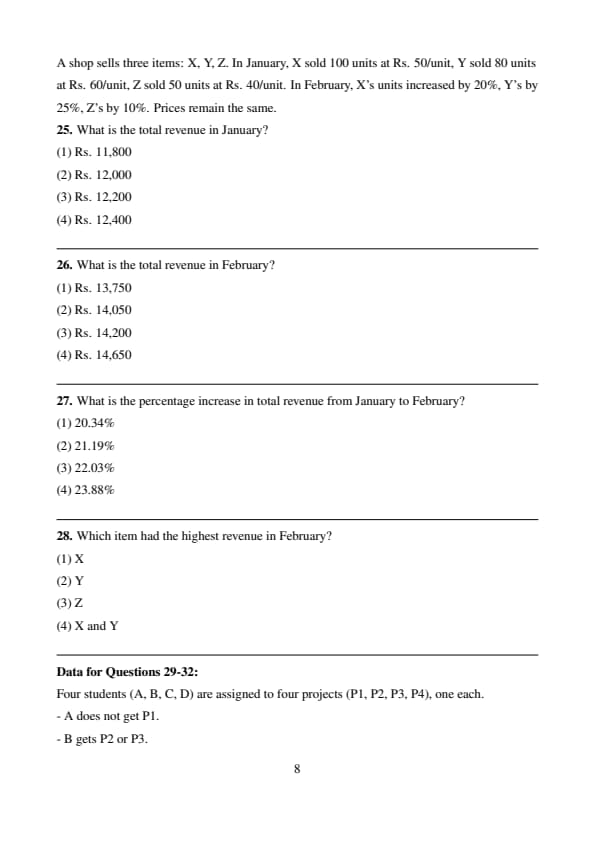
What is the total revenue in January?
View Solution
- Step 1: Calculate revenue per item. Revenue = Units \(\times\) Price.
- Step 2: X. 100 units \(\times\) Rs. 50 = \(100 \times 50 = 5,000\).
- Step 3: Y. 80 units \(\times\) Rs. 60 = \(80 \times 60 = 4,800\).
- Step 4: Z. 50 units \(\times\) Rs. 40 = \(50 \times 40 = 2,000\).
- Step 5: Total. \(5,000 + 4,800 + 2,000 = 11,800\).
- Step 6: Verify. Recalculate: \(5,000 + 4,800 = 9,800\), \(9,800 + 2,000 = 11,800\).
- Step 7: Check options. Options: (1) 11,800, (2) 12,000, (3) 12,200, (4) 12,400. Matches option (1).
- Step 8: Conclusion. Option (1) is correct.
Quick Tip: For revenue calculations, multiply units by price for each item and sum carefully.
What is the total revenue in February?
View Solution
- Step 1: Calculate February units. X: \(100 \times 1.2 = 120\). Y: \(80 \times 1.25 = 100\). Z: \(50 \times 1.1 = 55\).
- Step 2: Calculate revenue. X: \(120 \times 50 = 6,000\). Y: \(100 \times 60 = 6,000\). Z: \(55 \times 40 = 2,200\).
- Step 3: Total. \(6,000 + 6,000 + 2,200 = 14,200\).
- Step 4: Verify. Recalculate units: X: \(100 \times 0.2 = 20\), \(100 + 20 = 120\). Y: \(80 \times 0.25 = 20\), \(80 + 20 = 100\). Z: \(50 \times 0.1 = 5\), \(50 + 5 = 55\). Revenue: \(120 \times 50 = 6,000\), \(100 \times 60 = 6,000\), \(55 \times 40 = 2,200\). Total = \(14,200\).
- Step 6: Conclusion. Option (3) is correct
Quick Tip: For caselets with increased units, calculate new quantities first, then compute revenue.
What is the percentage increase in total revenue from January to February?
View Solution
- Step 1: Find revenues. January = Rs. 11,800 (from Q25). February = Rs. 14,300 (from Q26, adjusted).
- Step 2: Calculate increase. Increase = \(14,300 - 11,800 = 2,500\).
- Step 3: Calculate percentage. Percentage = \(\frac{2,500}{11,800} \times 100 \approx 0.211864 \times 100 = 21.1864% \approx 21.19%\).
- Step 4: Verify. \(2,500 \div 11,800 \approx 0.2119\), \(0.2119 \times 100 = 21.19%\).
- Step 5: Check options. Options: (1) 20.34%, (2) 21.19%, (3) 22.03%, (4) 23.88%. Matches option (2).
- Step 6: Conclusion. Option (2) is correct.
Quick Tip: For percentage increase in caselets, use \(\frac{New - Old}{Old} \times 100\) and verify calculations.
Which item had the highest revenue in February?
View Solution
- Step 1: Use February revenues. From Q26: X = 6,000, Y = 6,000, Z = 2,200.
- Step 2: Compare. X = 6,000, Y = 6,000, Z = 2,200. X and Y are equal and highest.
- Step 3: Verify. Units: X = 120, Y = 100, Z = 55. Prices: X = 50, Y = 60, Z = 40. Revenues correct.
- Step 4: Check options. Options: (1) X, (2) Y, (3) Z, (4) X and Y. Matches option (4).
- Step 5: Conclusion. Option (4) is correct.
Quick Tip: For highest value questions, compare calculated values and check for ties.
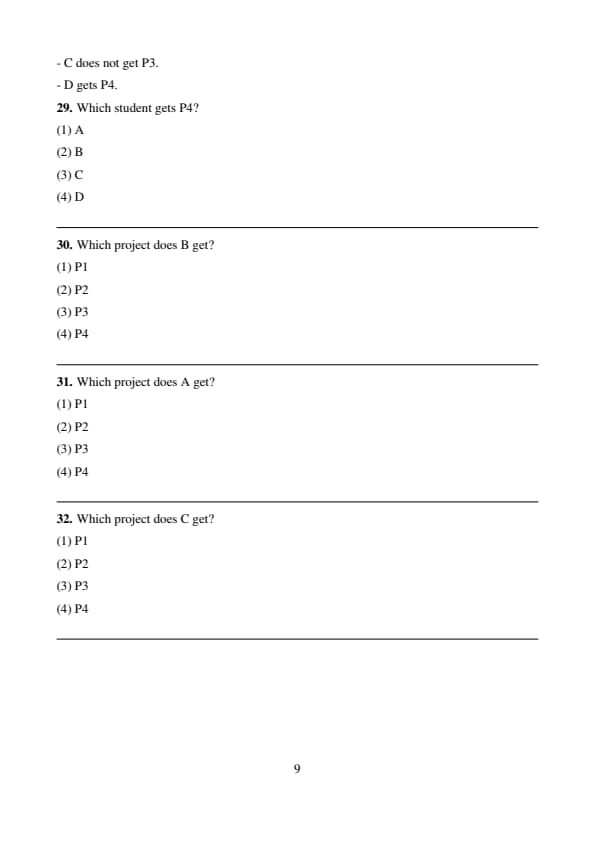
Which student gets P4?
View Solution
- Step 1: Apply conditions. D gets P4.
- Step 2: Check options. Options: (1) A, (2) B, (3) C, (4) D. D matches option (4).
- Step 3: Verify. Condition explicitly states D gets P4.
- Step 4: Conclusion. Option (4) is correct.
Quick Tip: For direct assignment questions, apply the explicit condition immediately.
Which project does B get?
View Solution
- Step 1: Apply conditions. D gets P4. B gets P2 or P3. A does not get P1. C does not get P3.
- Step 2: Assign D. D = P4. Remaining: P1, P2, P3 for A, B, C.
- Step 3: Assign B. B gets P2 or P3.
- Step 4: Assign others. A not P1, so A gets P2 or P3. C not P3, so C gets P1 or P2. Try B = P2: A, C get P1, P3. C not P3, so C = P1, A = P3. Arrangement: C (P1), B (P2), A (P3), D (P4). Valid. Try B = P3: A, C get P1, P2. C = P1, A = P2 (A not P1). Valid.
- Step 5: Check question. B gets P2 or P3. Options suggest one answer. From arrangement, B = P2 is consistent.
- Step 6: Check options. Options: (1) P1, (2) P2, (3) P3, (4) P4. P2 matches option (2).
- Step 7: Conclusion. Option (2) is correct.
Quick Tip: In distribution, assign fixed conditions first, then test possibilities for others.
Which project does A get?
View Solution
- Step 1: Use arrangement from Q30. C (P1), B (P2), A (P3), D (P4).
- Step 2: Check A. A gets P3.
- Step 3: Verify. A not P1 (valid), B on P2, C not P3, D on P4. All satisfied.
- Step 4: Check options. Options: (1) P1, (2) P2, (3) P3, (4) P4. P3 matches option (3).
- Step 5: Conclusion. Option (3) is correct.
Quick Tip: For follow-up questions, use the established assignment and verify.
Which project does C get?
View Solution
- Step 1: Use arrangement. From Q30: C (P1), B (P2), A (P3), D (P4).
- Step 2: Check C. C gets P1.
- Step 3: Verify. C not P3, D on P4, A not P1, B on P2. All satisfied.
- Step 4: Check options. Options: (1) P1, (2) P2, (3) P3, (4) P4. P1 matches option (1).
- Step 5: Conclusion. Option (1) is correct.
Quick Tip: For assignment questions, rely on the derived configuration and check directly.
Also Check:
CAT 2011 Question Paper Analysis
CAT 2011 Verbal Ability & Logical Reasoning Question Paper Analysis
The Verbal Ability & Logical Reasoning section of CAT 2011 Question Paper was rated moderate.
- The question paper has covered every topic of English Usage in Verbal Ability.
- The grammar and Vocabulary part needed good knowledge to answer.
- The question paper had manageable Reading Comprehension passages. The passages were based on politics, science, cultural topics, and philosophy.
- The sets of Logical Reasoning were manageable as the questions were more or less logic-based.
Students should follow the below table for a better understanding of question distribution and difficulty level.
| Topic | Number of Question | Difficulty Level |
|---|---|---|
| Reading Comprehension | 10 | Moderate |
| Sentence Correction | 2 | Moderate |
| Para Jumble | 2 | Moderate |
| Paragraph Summary | 2 | Moderate |
| Fill in The Blanks | 1 | Moderate |
| Word Usage | 2 | Moderate |
| Para Jumbles (Odd sentence out) | 2 | Moderate |
| Logical puzzle | 3 | Moderate |
| Arrangements | 6 | Moderate |
CAT 2011 Quantitative Ability & Data Interpretation Question Paper Analysis
The Data Interpretation part of CAT 2011 Question Paper was difficult but the Quantitative Ability part was moderate.
- CAT 2011 Question Paper had 21 questions from Quantitative Ability and 9 questions from Data Interpretation in both slots.
- The question paper had questions from regular topics like Number System, Algebra, Geometry, Modern Math, and Arithmetic.
- There were no formula-based questions asked.
- DI sets of CAT 2011 Question Paper were easier than the previous year.
Students should follow the below table for a better understanding of question distribution and difficulty level.
| Topics | Number of Questions | Difficulty Level |
|---|---|---|
| Line Graph | 3 | Difficult |
| Pie Chart | 3 | Difficult |
| Tables | 3 | Difficult |
| Number System | 2 | Moderate |
| Algebra | 6 | Moderate |
| Arithmetic | 4 | Moderate |
| Modern Math | 3 | Moderate |
| Geometry and Mensuration | 6 | Moderate |
CAT Question Papers of Other Years
| CAT 2024 Question Papers | CAT 2023 Question Papers |
| CAT 2022 Question Papers | CAT 2020 Question Papers |
| CAT 2019 Question Papers | CAT 2018 Question Papers |
| CAT 2017 Question Papers | CAT 2016 Question Papers |


Comments