


Texas Tech University acceptance rate for the Spring 2024 intake is 47.81% for UG and 48.65% for PG. This indicates admissions at Texas Tech University are moderately competitive for both undergraduate and graduate applicants. The university invites applications for admissions in spring, fall, and summer semesters every year. For the fall and summer admissions 2023, the overall acceptance rate of Texas Tech University was 70.89% for undergraduate admissions and 56.36% for graduate admissions.
Texas Tech University Acceptance Rate for Undergraduate Admissions
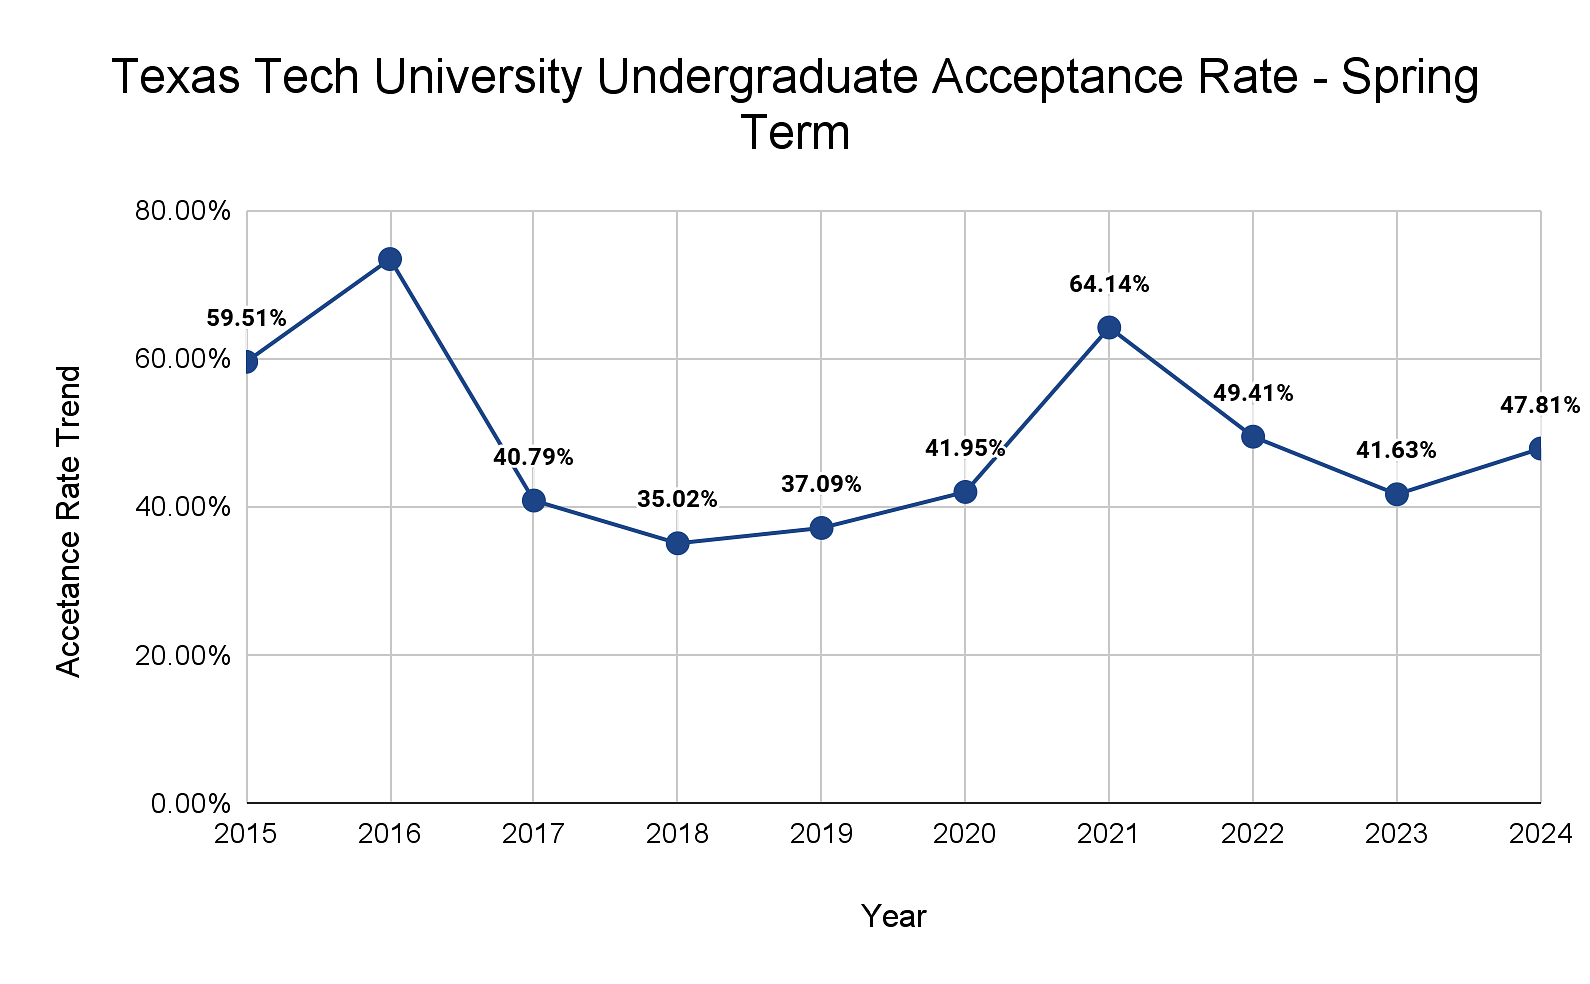
A total of 663 applications were received for spring 2024 undergraduate admissions at Texas Tech University. Of those, 317 applicants were given a place. The acceptance rate is 47.81% for 2024 Spring admissions, which is higher than the acceptance rate of 41.63% in 2023.
Spring Acceptance Rate
Given below is the acceptance rate trend for spring admissions over the last 10 years. The undergraduate acceptance rate kept changing over the years with the highest acceptance rate being 64.14% in 2021 and lowest being 35.02% in 2018.
| Year | Applications Received | Applications Accepted | Acceptance Rate |
|---|---|---|---|
| 2015 | 331 | 197 | 59.51% |
| 2016 | 278 | 204 | 73.38 |
| 2017 | 505 | 206 | 40.79% |
| 2018 | 414 | 145 | 35.02% |
| 2019 | 461 | 171 | 37.09% |
| 2020 | 317 | 133 | 41.95% |
| 2021 | 357 | 229 | 64.14% |
| 2022 | 514 | 254 | 49.41% |
| 2023 | 807 | 336 | 41.63% |
| 2024 | 663 | 317 | 47.81% |
Fall/Summer Acceptance Rate
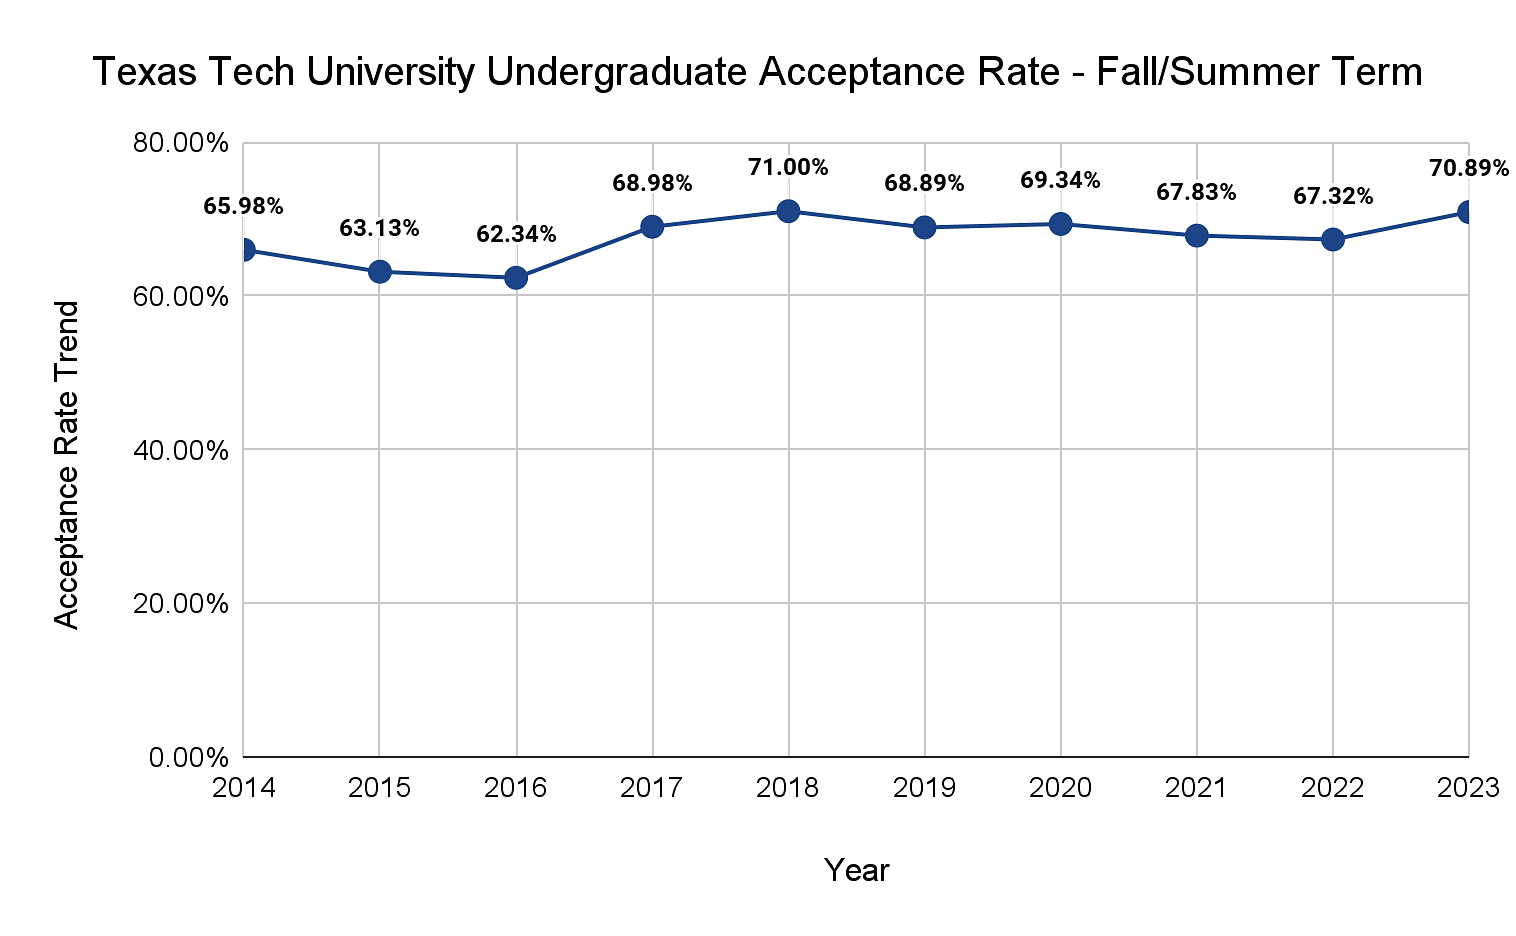
Following is the overall acceptance rate for fall and summer admissions to undergraduate programs. Considering the last 10 years trend, there is no significant change in the Texas Tech University acceptance rate. The acceptance rate generally remains between 65% to 71% every year.
| Year | Applications Received | Applications Accepted | Acceptance Rate |
|---|---|---|---|
| 2014 | 21,948 | 14,482 | 65.98% |
| 2015 | 23,157 | 14,621 | 63.13% |
| 2016 | 23,459 | 14,621 | 62.34% |
| 2017 | 25,339 | 17,481 | 68.98% |
| 2018 | 24,849 | 17,643 | 71% |
| 2019 | 25,498 | 17,566 | 68.89% |
| 2020 | 29,260 | 20,498 | 69.34% |
| 2021 | 33,786 | 22,920 | 67.83% |
| 2022 | 35,494 | 23,896 | 67.32% |
| 2023 | 34,143 | 24,207 | 70.89% |
Texas Tech University Acceptance Rate for Graduate Admissions
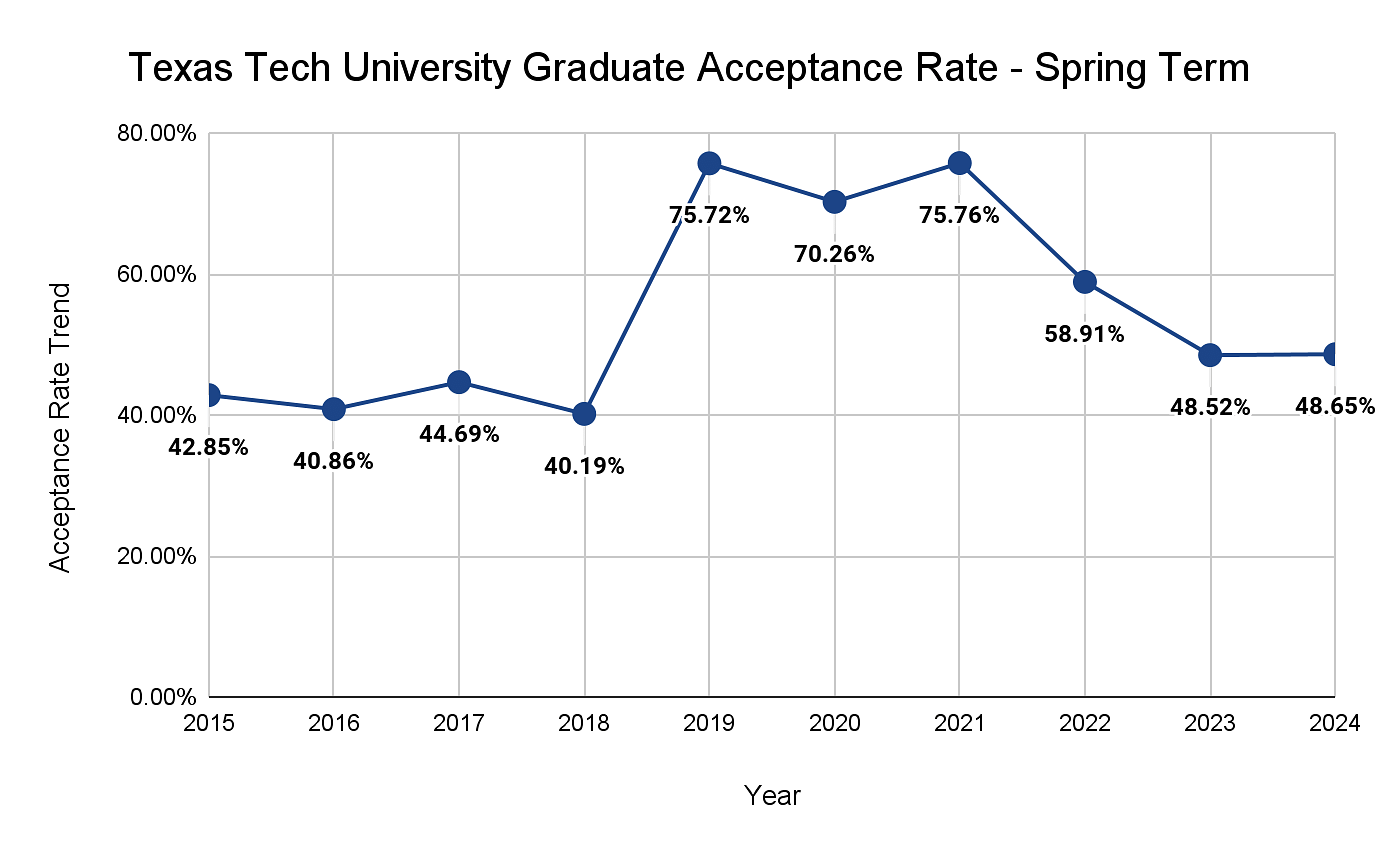
The acceptance rate for graduate admissions is mostly seen below 50% for spring intake over the years. However, the acceptance rate increased in 2019 when 75.72% applications were accepted. Texas Tech university admitted the highest number of applicants in 2021 witn 75.76% acceptance rate.
Spring Acceptance Rate
| Year | Applications Received | Applications Accepted | Acceptance Rate |
|---|---|---|---|
| 2015 | 1,414 | 606 | 42.85% |
| 2016 | 1,495 | 611 | 40.86% |
| 2017 | 1,320 | 590 | 44.69% |
| 2018 | 1,244 | 500 | 40.19% |
| 2019 | 1,075 | 814 | 75.72% |
| 2020 | 908 | 638 | 70.26% |
| 2021 | 1,560 | 1,182 | 75.76% |
| 2022 | 2,923 | 1,722 | 58.91% |
| 2023 | 4,095 | 1,987 | 48.52% |
| 2024 | 3,190 | 1,552 | 48.65% |
Fall/Summer Acceptance Rate
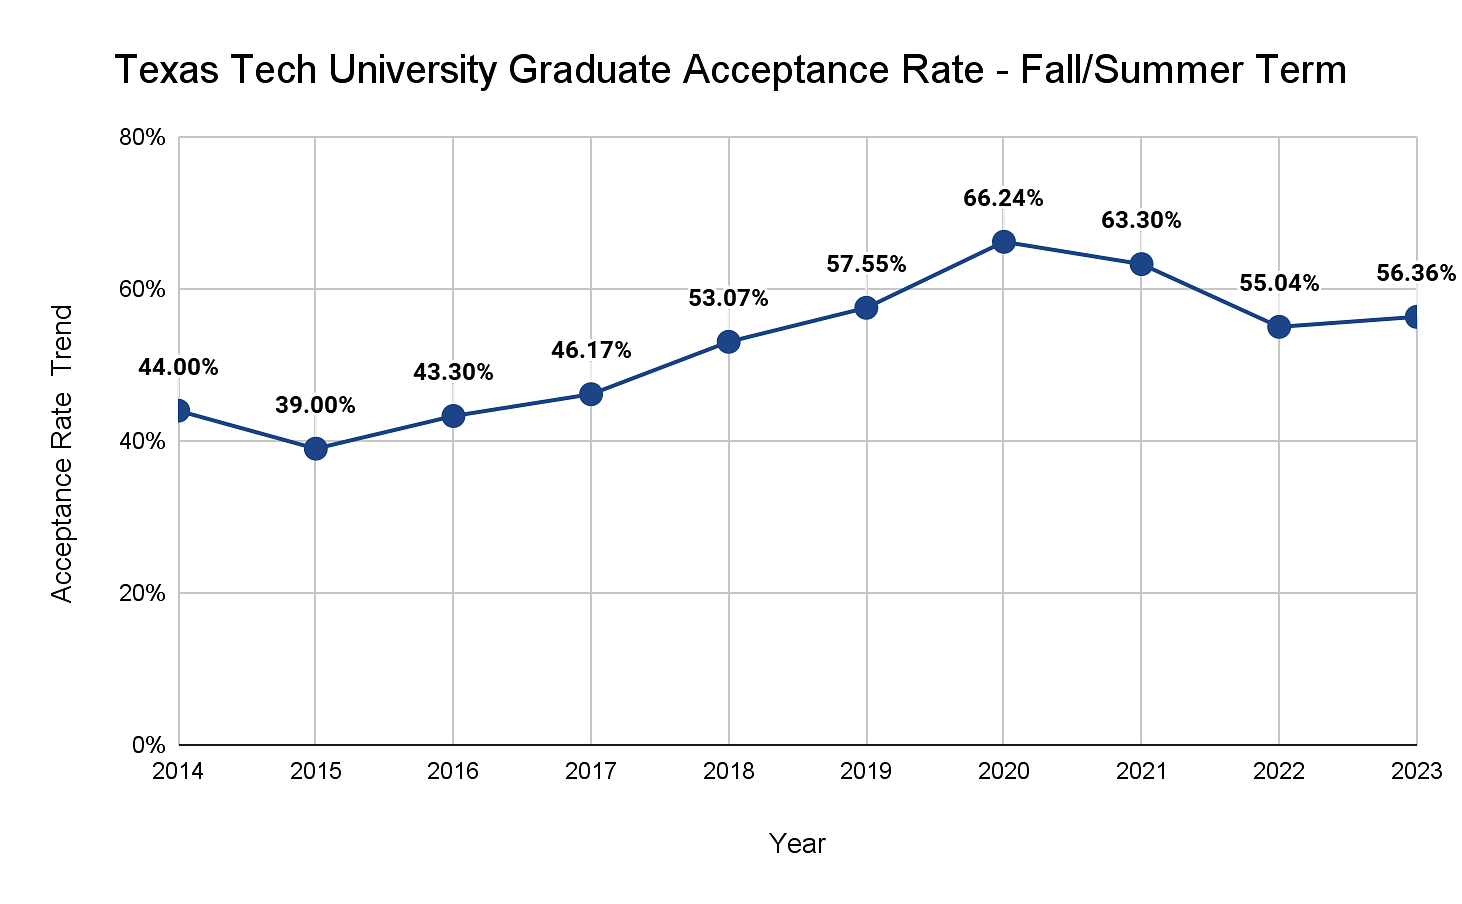
The fall and summer acceptance rate has significantly increased for graduate admissions at Texas Tech. In fact it admitted the highest number of applications in 2020, during the Covid 19 pandemic. A total of 5,988 applicants applied in 2020 and 66.24% of them were admitted. This still is the highest acceptance rate in last 10 years. However, the largest number of applications were admitted in 2023 with a total admissions of 5,935 students.
| Year | Applications Received | Applications Accepted | Acceptance Rate |
|---|---|---|---|
| 2014 | 6,340 | 2,794 | 44% |
| 2015 | 6,789 | 2,648 | 39% |
| 2016 | 6,502 | 2,816 | 43.30% |
| 2017 | 5,438 | 2,511 | 46.17% |
| 2018 | 5,340 | 2,834 | 53.07% |
| 2019 | 4,762 | 2,741 | 57.55% |
| 2020 | 5,988 | 3,967 | 66.24% |
| 2021 | 6,881 | 4,356 | 63.30% |
| 2022 | 9.943 | 5,473 | 55.04% |
| 2023 | 10,529 | 5,935 | 56.36% |
Texas Tech Acceptance Rate for Top Graduate Programs
Mentioned below are the acceptance rate trend for top courses at Texas Tech University including MBA, computer science and engineering graduate degrees.
Texas Tech Computer Science Acceptance Rate
| Year | Applications Received | Applications Accepted | Acceptance Rate |
|---|---|---|---|
| 2019 | 274 | 156 | 56.93% |
| 2020 | 334 | 205 | 61.37% |
| 2021 | 671 | 414 | 61.69% |
| 2022 | 2,200 | 671 | 30.5% |
| 2023 | 2,065 | 1,069 | 51.76% |
Texas Tech MBA Acceptance Rate
| Year | Applications Received | Applications Accepted | Acceptance Rate |
|---|---|---|---|
| 2019 | 445 | 255 | 57.30% |
| 2020 | 521 | 382 | 73.3% |
| 2021 | 500 | 357 | 71.4% |
| 2022 | 435 | 314 | 72.18% |
| 2023 | 491 | 329 | 67% |
Texas Tech Engineering Acceptance Rate
| Year | Applications Received | Applications Accepted | Acceptance Rate |
|---|---|---|---|
| 2019 | 1,056 | 569 | 53.88% |
| 2020 | 1,346 | 943 | 70.05% |
| 2021 | 1,805 | 1,170 | 64.81% |
| 2022 | 3,989 | 1,717 | 43.04% |
| 2023 | 4,011 | 1,864 | 46.47% |
Considering the overall acceptance trend, the admissions are moderately competitive at Texas Tech University. This signifies, getting admissions at Texas Tech University is not that difficult. Applicants who wish to secure admissions at Texas Tech University must have at least 3.0 (85%) to make themselves.


Comments