Ellingham diagram represents a graph of
- $\Delta\, G\, Vs\, T$
- $\Delta \, G ^\circ \,Vs\, T$
- $\Delta S\, Vs\, P$
- $\Delta G\, Vs\, P$
The Correct Option is B
Solution and Explanation
Top Questions on General Principles and Processes of Isolation of Elements
- On reaction of Lead Sulphide with dilute nitric acid which of the following is not formed ?
- JEE Main - 2024
- Chemistry
- General Principles and Processes of Isolation of Elements
- Given below are two statements:
Statement I : During Electrolytic refining, the pure metal is made to act as anode and its impure metallic form is used as cathode
Statement II : During the Hall-Heroult electrolysis process, purified $Al _2 O _3$ is mixed with $Na _3 AlF _6$ to lower the melting point of the mixture
In the light of the above statements, choose the most appropriate answer from the options given below:- JEE Main - 2023
- Chemistry
- General Principles and Processes of Isolation of Elements
The reaction that does NOT take place in a blast furnace between 900 K to 1500 K temperature range during extraction of iron is?
- NEET (UG) - 2023
- Chemistry
- General Principles and Processes of Isolation of Elements
Consider the following statements about the oxides of halogens
A. At room temperature, OF2; is thermally stable
B. Order of stability of oxides of halogens is I > Br > Cl
C. I2O5 is used in the estimation of CO
D. ClO2; is used as a bleaching agent
The correct statements are- TS EAMCET - 2023
- Chemistry
- General Principles and Processes of Isolation of Elements
- Which of the following ore is not in oxide form?
- GUJCET - 2023
- Chemistry
- General Principles and Processes of Isolation of Elements
Questions Asked in KCET exam
- If \(\lim\limits_{x \rightarrow 0} \frac{\sin(2+x)-\sin(2-x)}{x}\)= A cos B, then the values of A and B respectively are
- KCET - 2023
- limits of trigonometric functions
- The Curie temperatures of Cobalt and iron are 1400K and 1000K respectively. At T = 1600K , the ratio of magnetic susceptibility of Cobalt to that of iron is
- KCET - 2023
- Magnetism and matter
- A particle is in uniform circular motion. Related to one complete revolution of the particle, which among the stataments is incorrect ?
- KCET - 2023
- Uniform Circular Motion
- The modulus of the complex number \(\frac{(1+i)^2(1+3i)}{(2-6i)(2-2i)}\) is
- KCET - 2023
- complex numbers
- The energy gap of an LED is 2.4 eV. When the LED is switched ‘ON’, the momentum of the emitted photons is
- KCET - 2023
- Semiconductor electronics: materials, devices and simple circuits
Concepts Used:
General Principles and Processes of Isolation of Elements
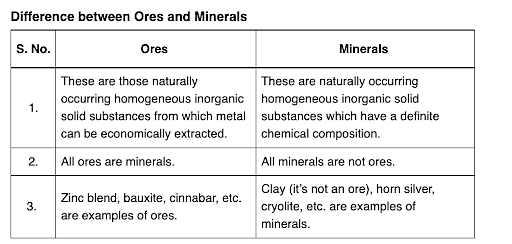
What are Ores and Minerals?
Minerals are the naturally occurring, homogeneous inorganic solid substances. They are having a definite chemical composition and crystalline structure, hardness and color. For example, copper pyrite, calamine, etc.

Impurities in an ore are called gauge. The removal of a gauge from the ore is called concentration ore.
Several steps are involved in the extraction of pure metal from ores. Major steps are as follows –
- Concentration of the ore
- Isolation of the metal from its concentrated ore
- Purification of the metal


