Question:
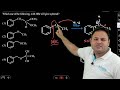
Which one of the following, with HBr, will give a phenol?
Which one of the following, with HBr, will give a phenol?
Show Hint
Aromatic ethers react with HBr to undergo nucleophilic substitution, where the bond between the oxygen atom and the alkyl group is broken, yielding phenol and the corresponding alkyl halide.
Updated On: Mar 25, 2026


Hide Solution
Verified By Collegedunia
The Correct Option is B
Solution and Explanation
The reaction of an aromatic ether with HBr results in the cleavage of the C-O bond, leading to the formation of a phenol. For the compound \( \text{CH}_3\text{C}_6\text{H}_4\text{OCH}_3 \), this cleavage results in the formation of phenol (\( \text{C}_6\text{H}_5\text{OH} \)) and methyl bromide (\( \text{CH}_3\text{Br} \)).
Thus, the correct answer is \( \boxed{(2)} \).
Was this answer helpful?
1
0
Learn with videos:
Top JEE Main Chemistry Questions
- Consider the dissociation equilibrium of the following weak acid: \[ \mathrm{HA \rightleftharpoons H^+(aq) + A^-(aq)} \] If the \(pK_a\) of the acid is \(4\), then the pH of a \(10\ \text{mM}\) HA solution is ________ (Nearest integer). (Given: The degree of dissociation can be neglected with respect to unity)
- For a given reaction at 400 K (R = 0.082 atm-L/mol-K) \[ xA \longleftrightarrow yB \] Given (i) \(K_f = 0.82\), \(K_c = 25.7\)
(ii) \(K_f = 8.2\), \(K_c = 0.25\)
Then which will be the correct combination of x & y for above set (i) & set (ii) data?
- JEE Main - 2026
- Chemistry
- Law Of Chemical Equilibrium And Equilibrium Constant
- Identify the correct statements:
A. Hydrated salts can be used as primary standard.
B. Primary standard should not undergo any reaction with air.
C. Reactions of primary standard with another substance should be instantaneous and stoichiometric.
D. Primary standard should not be soluble in water.
E. Primary standard should have low relative molar mass.
Choose the correct answer from the options given below:- JEE Main - 2026
- Chemistry
- Analytical Chemistry
Match the LIST-I with LIST-II.

Choose the correct answer from the options given below:- JEE Main - 2026
- Chemistry
- Thermodynamics
- The correct order of reactivity of CH$_3$Br in methanol with the following nucleophiles is
$ \mathrm{F^- ,\ I^- ,\ C_2H_5O^- \ and\ C_6H_5O^- }$- JEE Main - 2026
- Chemistry
- Nucleophilic and electrophilic substitution reactions (both aromatic and aliphatic)
View More Questions
Top JEE Main Organic Chemistry Questions
- The final product [B] is:


- JEE Main - 2026
- Chemistry
- Organic Chemistry
Which one of the following graphs accurately represents the plot of partial pressure of CS₂ vs its mole fraction in a mixture of acetone and CS₂ at constant temperature?


- JEE Main - 2026
- Chemistry
- Organic Chemistry
- \(0.53\ \text{g}\) of an organic compound \(X\) when heated with excess concentrated nitric acid and then with silver nitrate gave \(0.75\ \text{g}\) of silver bromide precipitate. \(1.0\ \text{g}\) of \(X\) gave \(1.32\ \text{g}\) of \(\mathrm{CO_2}\) on combustion. Find the percentage of hydrogen in compound \(X\). (Nearest integer) [Given: Atomic masses (g mol\(^{-1}\)): H = 1, C = 12, Br = 80, Ag = 108, O = 16]
- JEE Main - 2026
- Chemistry
- Organic Chemistry
- The IUPAC name of the following compound is:

- JEE Main - 2026
- Chemistry
- Organic Chemistry
- Consider the following reaction:

- JEE Main - 2026
- Chemistry
- Organic Chemistry
View More Questions
Top JEE Main Questions
Which of the following best represents the temperature versus heat supplied graph for water, in the range of \(-20^\circ\text{C}\) to \(120^\circ\text{C}\)?

- JEE Main - 2026
- Thermodynamics
- For two identical cells each having emf \(E\) and internal resistance \(r\), the current through an external resistor of \(6\,\Omega\) is the same when the cells are connected in series as well as in parallel. The value of the internal resistance \(r\) is ________ \(\Omega\).
- JEE Main - 2026
- Current electricity
- Consider the dissociation equilibrium of the following weak acid: \[ \mathrm{HA \rightleftharpoons H^+(aq) + A^-(aq)} \] If the \(pK_a\) of the acid is \(4\), then the pH of a \(10\ \text{mM}\) HA solution is ________ (Nearest integer). (Given: The degree of dissociation can be neglected with respect to unity)
- JEE Main - 2026
- Solutions
- In parallax method for the determination of focal length of a concave mirror, the object should always be placed:
- JEE Main - 2026
- Ray optics and optical instruments
- Let $\alpha, \beta$ be the roots of the quadratic equation \[ 12x^2 - 20x + 3\lambda = 0,\ \lambda \in \mathbb{Z}. \] If \[ \frac{1}{2} \le |\beta-\alpha| \le \frac{3}{2}, \] then the sum of all possible values of $\lambda$ is
- JEE Main - 2026
- Quadratic Equations
View More Questions