>
SNAP
>
Quantitative Ability and Data Interpretation
List of top Quantitative Ability and Data Interpretation Questions on Bar Graph asked in SNAP
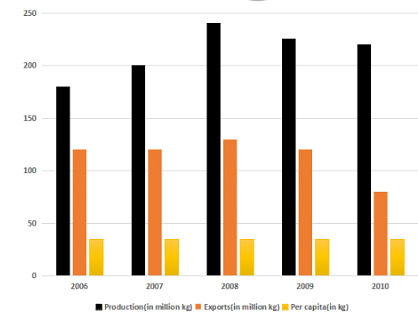
The following bar graph gives the production, exports and per capita consumption of rice in country A, for the five years from 2006 to 2010.
Consumption = Production - Exports Per Capita Consumption = (Consumption) (Population)
SNAP - 2011
SNAP
Quantitative Ability and Data Interpretation
Bar Graph
Refer to the given bar diagram showing the sales (in Rs. crores) of top market brands among pain killers in India and answer the questions.
SNAP - 2010
SNAP
Quantitative Ability and Data Interpretation
Bar Graph
Answer the following questions based on the information given below.
SNAP - 2008
SNAP
Quantitative Ability and Data Interpretation
Bar Graph