Comprehension
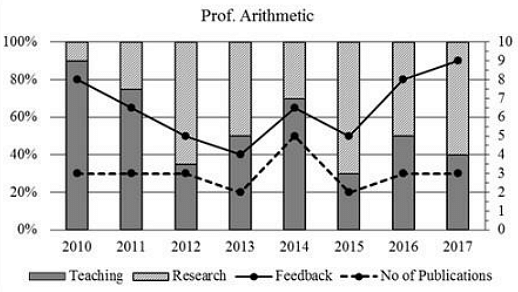
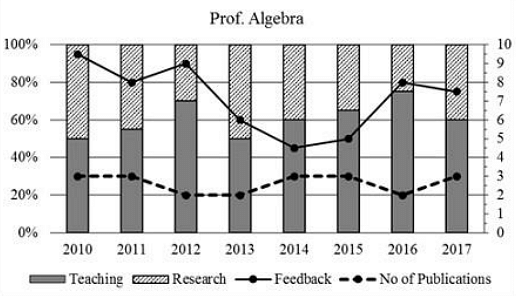
The graphs below represent the performance of four professors, across years, measured on four variables: Percentage of time spent on teaching, percentage of time spent on research, feedback (on a scale of 10, right-hand side) and number of publications (right-hand side). Assume that the cumulative time spent per year on research and teaching activities are same for all four professors and each of them taught only one course of 90 classroom hours.


Question: 1
Which of the following, shows the maximum year to year percentage growth in feedback?
Which of the following, shows the maximum year to year percentage growth in feedback?
Updated On: Aug 9, 2024
- Professor Artihmetic during 2013-2014
- Professor Algebra during 2015-2016
- Professor Calculus during 2012-2013
- Professor Calculus during 2014-2015
- None of the above
Hide Solution
Verified By Collegedunia
The Correct Option is C
Solution and Explanation
The correct option is (C) : Professor Calculus during 2012-2013
Was this answer helpful?
0
0
Question: 2
Count the number of instances in which "annual decreasing efforts in research" is accompanied with "annual increase in feedback"?
Count the number of instances in which "annual decreasing efforts in research" is accompanied with "annual increase in feedback"?
Updated On: Aug 9, 2024
- 5
- 7
- 9
- 11
- None of the above
Hide Solution
Verified By Collegedunia
The Correct Option is C
Solution and Explanation
The correct option is (C) : 9
Was this answer helpful?
0
0
Question: 3
Research efficiency is the ratio of cumulative number of publication for a period of 3 years to the cumulative number of hours spent on research activity in those 3 years. Which of the following professors is the least efficient researcher for the period 2015 to 2017?
Research efficiency is the ratio of cumulative number of publication for a period of 3 years to the cumulative number of hours spent on research activity in those 3 years. Which of the following professors is the least efficient researcher for the period 2015 to 2017?
Updated On: Aug 9, 2024
- Professor Artihmetic
- Professor Algebra
- Professor Geometry
- Professor Calculus
- Cannot be determined as research is expressed in percentage
Hide Solution
Verified By Collegedunia
The Correct Option is A
Solution and Explanation
The correct option is (A) : Professor Artihmetic
Was this answer helpful?
0
0
Top Questions on Bar Graph
- Analyse the bar graph carefully and answer the following questions.

- A pencil maker ships pencils in boxes of size 50, 100 and 200. Due to packaging issues, some pencils break. About the 20 boxes he has supplied to a shop, the following information is available:
✦ Box no. 1 through 6 have 50 pencils, Box no. 7 through 16 have 100 pencils and Box no. 17 through 20 have 200 pencils.
✦ No box has less than 5% or more than 20% broken pencils.
Following is the frequency table of the number of broken pencils for the twenty boxes: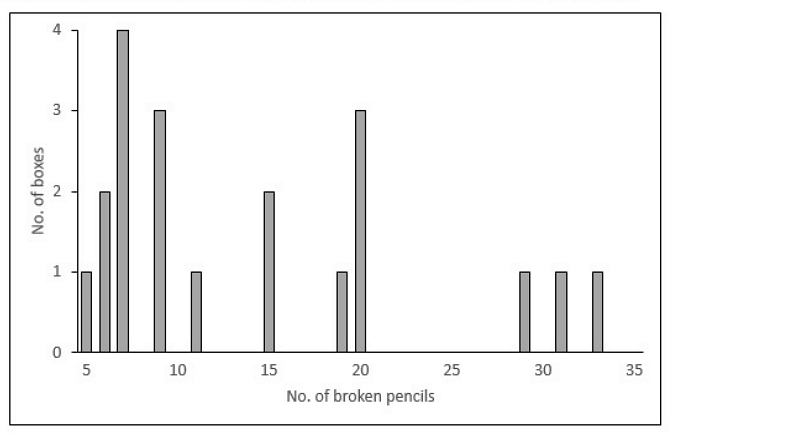
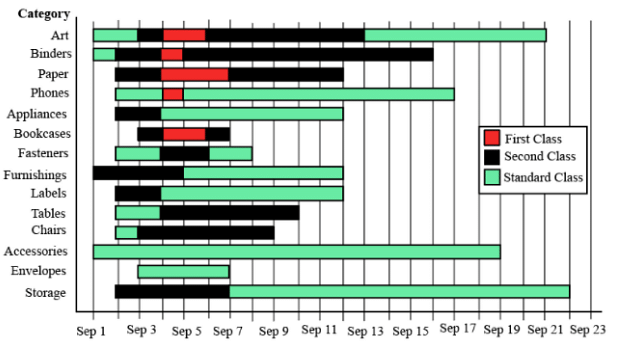
The different bars in the diagram above provide information about different orders in various categories (Art, Binders, ….) that were booked in the first two weeks of September of a store for one client. The colour and pattern of a bar denotes the ship mode (First Class / Second Class / Standard Class). The left end point of a bar indicates the booking day of the order, while the right end point indicates the dispatch day of the order. The difference between the dispatch day and the booking day (measured in terms of the number of days) is called the processing time of the order. For the same category, an order is considered for booking only after the previous order of the same category is dispatched. No two consecutive orders of the same category had identical ship mode during this period.
For example, there were only two orders in the furnishing category during this period. The first one was shipped in the Second Class. It was booked on Sep 1 and dispatched on Sep 5. The second order was shipped in the Standard class. It was booked on Sep 5 (although the order might have been placed before that) and dispatched on Sep 12. So the processing times were 4 and 7 days respectively for these orders.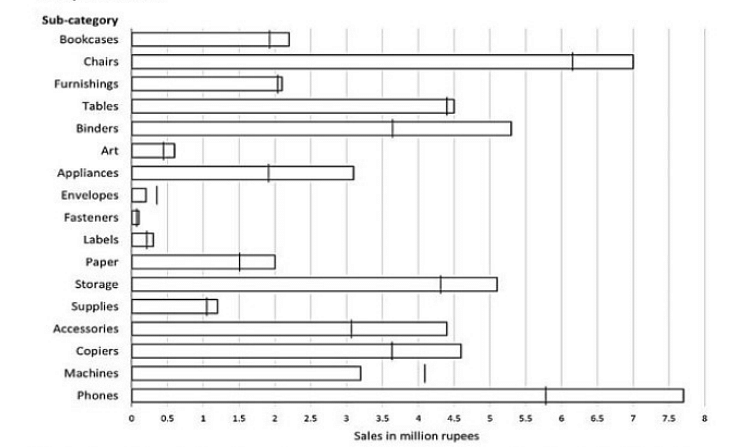
The horizontal bars in the above diagram represent 2020 aggregate sales (in ₹ million) of a company for the different subcategories of its products. The top four product subcategories (Bookcases, Chairs, Furnishings, Tables) belong to furniture product category; the bottom four product subcategories (Accessories, Copiers, Machines, Phones) belong to the technology product category while all other product subcategories belong to the office supply product category. For each of the product subcategories, there is a vertical line indicating the sales of the corresponding subcategory in 2019.- Read the information given below and answer the 3 associated questions.
The following graph depicts sector-wise percentage contributions to the gross domestic product (GDP) of nine nations, labelled “Nation A”, “Nation B” and so on. It is known that these nations are Brazil, China, France, Germany, India, Japan, Russia, the UK and the USA, but not necessarily in the same order.
The following, however, are known:
i) The GDPs of the nine nations (in US $ trillion) are:ii) China has the highest agriculture sector GDP, valued at US $1 trillion, followed respectively by the USA and IndiaNation Brazil China France Germany Japan India Russia UK USA GDP 2 10 3 4 5 2 2 3 17
iii) In terms of percentage contribution to the respective nations’ GDPs by their service sectors, the UK and France are respectively the first and the second
iv) Nation A, Nation B and Nation G have the same GDP
v) The GDP of India’s industry sector is lower than the GDP of Russia’s industry sector. However, it is larger than that of Brazil's industry sector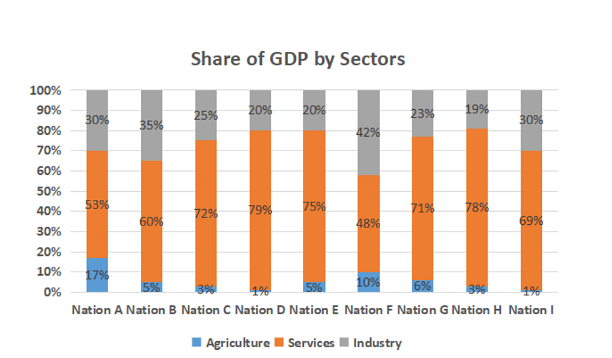
View More Questions
Questions Asked in XAT exam
- FS food stall sells only chicken biryani. If FS fixes a selling price of Rs. 160 per plate, 300 plates of biriyani are sold. For each increase in the selling price by Rs. 10 per plate, 10 fewer plates are sold. Similarly, for each decrease in the selling price by Rs. 10 per plate, 10 more plates are sold. FS incurs a cost of Rs. 120 per plate of biriyani, and has decided that the selling price will never be less than the cost price. Moreover, due to capacity constraints, more than 400 plates cannot be produced in a day.
If the selling price on any given day is the same for all the plates and can only be a multiple of Rs. 10, then what is the maximum profit that FS can achieve in a day?- XAT - 2024
- Profit and Loss
- A local restaurant has 16 vegetarian items and 9 non-vegetarian items in their menu. Some items contain gluten, while the rest are gluten-free.
One evening, Rohit and his friends went to the restaurant. They planned to choose two different vegetarian items and three different non-vegetarian items from the entire menu. Later, Bela and her friends also went to the same restaurant: they planned to choose two different vegetarian items and one non-vegetarian item only from the gluten-free options. The number of item combinations that Rohit and his friends could choose from, given their plan, was 12 times the number of item combinations that Bela and her friends could choose from, given their plan.
How many menu items contain gluten?- XAT - 2024
- permutations and combinations
- Which of the following Indian states does the River Ganges not flow through?
- XAT - 2024
- Static GK
- What is X-37B?
- XAT - 2024
- Scientific Developments
- Which of the following years is NOT a leap year?
- XAT - 2024
- Static GK
View More Questions


