Comprehension
Study the following graph carefully and then answer the questions based on it. The percentage of five different types of cars produced by a company during two years is given below.


Question: 1
What was the difference in the production of C type cars between 1996 and 1997?
What was the difference in the production of C type cars between 1996 and 1997?
Updated On: Oct 24, 2024
- 31000
- 7500
- 5000
- 2500
Hide Solution
Verified By Collegedunia
The Correct Option is A
Solution and Explanation
The correct option is (A): 31000
Was this answer helpful?
0
0
Question: 2
If 85\(\%\) of E type cars produced during 1996 and 1997 are being sold by the company, then how many E type cars are left unsold by the company?
If 85\(\%\) of E type cars produced during 1996 and 1997 are being sold by the company, then how many E type cars are left unsold by the company?
Updated On: Oct 24, 2024
- 29100
- 21825
- 142800
- None of these
Hide Solution
Verified By Collegedunia
The Correct Option is D
Solution and Explanation
The correct option is (D): None of these
Was this answer helpful?
0
0
Question: 3
If the number of A type cars manufactured in 1997 was the same as that of 1996, what would have been its approximate percentage share in the total production of 1997?
If the number of A type cars manufactured in 1997 was the same as that of 1996, what would have been its approximate percentage share in the total production of 1997?
Updated On: Oct 24, 2024
- 15
- 13
- 11
- 9
Hide Solution
Verified By Collegedunia
The Correct Option is B
Solution and Explanation
The correct option is (B): 13
Was this answer helpful?
0
0
Question: 4
In the case of which of the following types of cars was the percentage increase from 1996 to 1997 the maximum?
In the case of which of the following types of cars was the percentage increase from 1996 to 1997 the maximum?
Updated On: Oct 24, 2024
- D
- E
- A
- C
Hide Solution
Verified By Collegedunia
The Correct Option is A
Solution and Explanation
The correct option is (A): D
Was this answer helpful?
0
0
Top Questions on Bar Graph
- Analyse the bar graph carefully and answer the following questions.

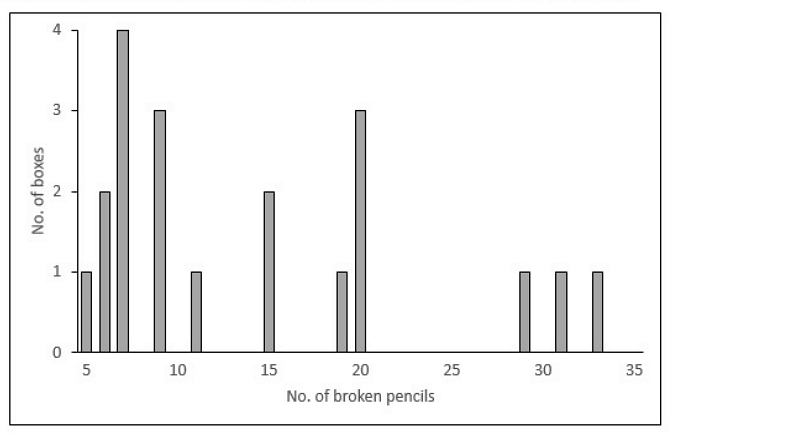
- A pencil maker ships pencils in boxes of size 50, 100 and 200. Due to packaging issues, some pencils break. About the 20 boxes he has supplied to a shop, the following information is available:
✦ Box no. 1 through 6 have 50 pencils, Box no. 7 through 16 have 100 pencils and Box no. 17 through 20 have 200 pencils.
✦ No box has less than 5% or more than 20% broken pencils.
Following is the frequency table of the number of broken pencils for the twenty boxes:

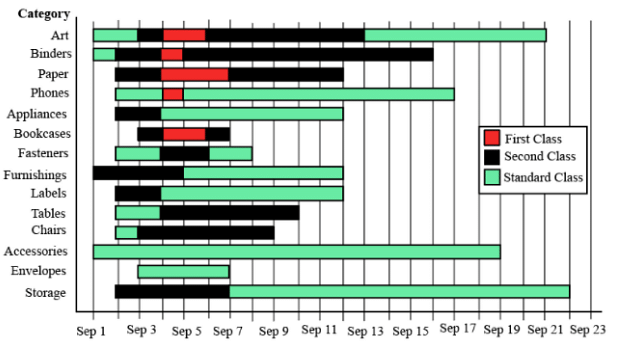
The different bars in the diagram above provide information about different orders in various categories (Art, Binders, ….) that were booked in the first two weeks of September of a store for one client. The colour and pattern of a bar denotes the ship mode (First Class / Second Class / Standard Class). The left end point of a bar indicates the booking day of the order, while the right end point indicates the dispatch day of the order. The difference between the dispatch day and the booking day (measured in terms of the number of days) is called the processing time of the order. For the same category, an order is considered for booking only after the previous order of the same category is dispatched. No two consecutive orders of the same category had identical ship mode during this period.
For example, there were only two orders in the furnishing category during this period. The first one was shipped in the Second Class. It was booked on Sep 1 and dispatched on Sep 5. The second order was shipped in the Standard class. It was booked on Sep 5 (although the order might have been placed before that) and dispatched on Sep 12. So the processing times were 4 and 7 days respectively for these orders.
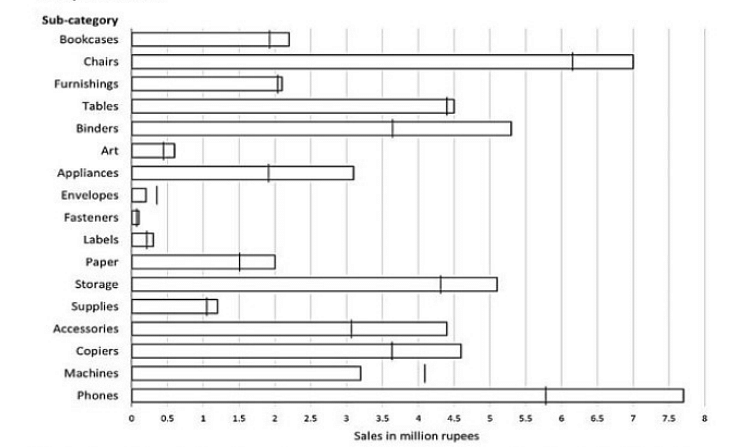
The horizontal bars in the above diagram represent 2020 aggregate sales (in ₹ million) of a company for the different subcategories of its products. The top four product subcategories (Bookcases, Chairs, Furnishings, Tables) belong to furniture product category; the bottom four product subcategories (Accessories, Copiers, Machines, Phones) belong to the technology product category while all other product subcategories belong to the office supply product category. For each of the product subcategories, there is a vertical line indicating the sales of the corresponding subcategory in 2019.- Read the information given below and answer the 3 associated questions.
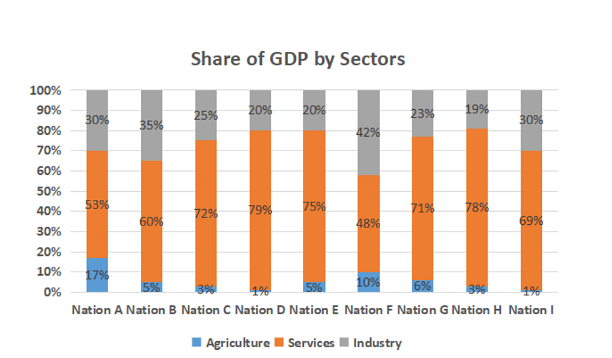
The following graph depicts sector-wise percentage contributions to the gross domestic product (GDP) of nine nations, labelled “Nation A”, “Nation B” and so on. It is known that these nations are Brazil, China, France, Germany, India, Japan, Russia, the UK and the USA, but not necessarily in the same order.
The following, however, are known:
i) The GDPs of the nine nations (in US $ trillion) are:ii) China has the highest agriculture sector GDP, valued at US $1 trillion, followed respectively by the USA and IndiaNation Brazil China France Germany Japan India Russia UK USA GDP 2 10 3 4 5 2 2 3 17
iii) In terms of percentage contribution to the respective nations’ GDPs by their service sectors, the UK and France are respectively the first and the second
iv) Nation A, Nation B and Nation G have the same GDP
v) The GDP of India’s industry sector is lower than the GDP of Russia’s industry sector. However, it is larger than that of Brazil's industry sector
View More Questions
Questions Asked in NMAT exam
- Sumeet spends 10% of his salary on his child’s education, 20% of the remainder on rent and 25% of the balance on garments. Finally, he is left with $ 5,400. What is his salary?
- NMAT - 2022
- Commercial Maths
- Directions: Go through the given table and solve the questions based on it
State
Total Population
(in Lakhs)Male Population
(in Lakhs)Rural Population
(\(\%\))Area
(in Sq. Km)2001 2006 2001 2006 2001 2006 Uttar Pradesh 1660 1731 875 911 71 70 2,38,576 Madhya Pradesh 603 674 314 360 72 71 3,08,144 Andhra Pradesh 761 823 385 417 69 68 2,75,068 Tamil Nadu 624 697 315 348 70 67 1,30,058 Orissa 368 384 186 195 73 72 1,55,707 Maharashtra 968 1013 504 527 68 66 3,07,713 West Bengal 802 865 412 446 69 68 88,752 - NMAT - 2022
- Percentage
- Directions: Go through the given graphs and solve the questions based on them.


- NMAT - 2022
- Percentage
- Directions: Read the passage below. Solve the question based on the information in the passage.
Ajay would do five tasks: A, B, C, D and E, starting at 9:00 a.m. A is the first task and takes 2 hours. B can be done after A is complete and requires 1 hour. Work on C, which would take 1 hour, can start only after A and B are completed. Ajay can do task D along with B and C, and would take 3 hours. Activity E, with duration of 1 hour, can start upon completion of A, B, C and D.- NMAT - 2022
- Puzzle
- Directions: In a marriage party, 278 guests were present. Twenty guests took Pepsi and Dew, 23 guests took Dew and Sprite, 21 guests took Pepsi and Sprite, and 9 guests took all three cold drinks (Pepsi, Sprite and Dew). It is also known that there were equal numbers of bottles of each of the three kinds (Pepsi, Dew and Sprite).
- NMAT - 2022
- Puzzle
View More Questions


