Question:
Go through the information given below, and answer the questions that follow.
The three graphs below capture the relationship between economic (and social) activities and subjective well-being. The first graph (Graph-1) captures the relationship between GDP (per capita) and Satisfaction with life, across different countries and four islands: Gizo, Roviana, Niijhum Dwip, and Chittagong. Graph 2 captures three measures of subjective well-being (Satisfaction with life, Affect Balance and Momentary Affect) across the four islands, which have different monetization levels (Index). Graph 3 captures levels of thirteen different socio-economic activities across four islands.


Which of the following will BEST capture the relationship between GDP (x-axis) and Life Satisfaction (y-axis) of countries?
Go through the information given below, and answer the questions that follow.
The three graphs below capture the relationship between economic (and social) activities and subjective well-being. The first graph (Graph-1) captures the relationship between GDP (per capita) and Satisfaction with life, across different countries and four islands: Gizo, Roviana, Niijhum Dwip, and Chittagong. Graph 2 captures three measures of subjective well-being (Satisfaction with life, Affect Balance and Momentary Affect) across the four islands, which have different monetization levels (Index). Graph 3 captures levels of thirteen different socio-economic activities across four islands.


Which of the following will BEST capture the relationship between GDP (x-axis) and Life Satisfaction (y-axis) of countries?
The three graphs below capture the relationship between economic (and social) activities and subjective well-being. The first graph (Graph-1) captures the relationship between GDP (per capita) and Satisfaction with life, across different countries and four islands: Gizo, Roviana, Niijhum Dwip, and Chittagong. Graph 2 captures three measures of subjective well-being (Satisfaction with life, Affect Balance and Momentary Affect) across the four islands, which have different monetization levels (Index). Graph 3 captures levels of thirteen different socio-economic activities across four islands.


Which of the following will BEST capture the relationship between GDP (x-axis) and Life Satisfaction (y-axis) of countries?
Updated On: Aug 9, 2024
- y=x
y=x2
- y = log (x)
y = \(\frac{1}{x^2}\)
- y = ex
Hide Solution
Verified By Collegedunia
The Correct Option is C
Solution and Explanation
The relationship between GDP (x-axis) & Life Satisfaction (y-axis) of countries is:
y = log (x)
So, the correct option is C.
Was this answer helpful?
0
0
Top Questions on Pie Charts
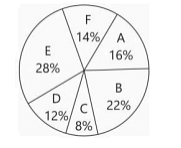
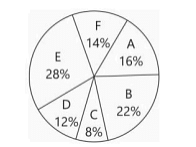
- Study the pie chart and table and answer the questions
Store Respective ratio of number of linen kurtis to cotton kurtis sold A 7:5 B 5:6 C 3:2 D 5:3 E 4:3 F 7:3 
Number of kurtis (linen and cotton) sold by store D is what percent more than the number of linen kurtis sold by store B? - Study the pie chart and table and answer the questions
Store Respective ratio of number of linen kurtis to cotton kurtis sold A 7:5 B 5:6 C 3:2 D 5:3 E 4:3 F 7:3 
What is the difference between average number of linen kurtis sold by stores D and E together and average number of cotton kurtis sold by the same stores together? - Study the pie chart and table and answer the questions
Store Respective ratio of number of linen kurtis to cotton kurtis sold A 7:5 B 5:6 C 3:2 D 5:3 E 4:3 F 7:3 
What is the respective ratio between number of kurtis (linen and cotton) sold by store C and number of linen kurtis sold by store F? - Go through the information given below, and answer the questions that follow.
The three graphs below capture the relationship between economic (and social) activities and subjective wellbeing. The first graph (Graph-1) captures the relationship between GDP (per-capita) and Satisfaction with life, across different countries and four islands: Gizo, Roviana, Niijhum Dwip, and Chittagong. The Graph-2 captures three different measures of subjective well-being (Satisfaction with life, Affect Balance and Momentary Affect) across the four islands, which have different levels monetization (Index). The Graph-3 captures levels of thirteen different socio-economic activities across four islands.
Which of the following site has the highest fishing to economic ratio? - Go through the information given below, and answer the questions that follow.
The three graphs below capture the relationship between economic (and social) activities and subjective wellbeing. The first graph (Graph-1) captures the relationship between GDP (per-capita) and Satisfaction with life, across different countries and four islands: Gizo, Roviana, Niijhum Dwip, and Chittagong. The Graph-2 captures three different measures of subjective well-being (Satisfaction with life, Affect Balance and Momentary Affect) across the four islands, which have different levels monetization (Index). The Graph-3 captures levels of thirteen different socio-economic activities across four islands.
Which of the following, about the four islands, can be BEST inferred from the graphs?
View More Questions
Questions Asked in XAT exam
- FS food stall sells only chicken biryani. If FS fixes a selling price of Rs. 160 per plate, 300 plates of biriyani are sold. For each increase in the selling price by Rs. 10 per plate, 10 fewer plates are sold. Similarly, for each decrease in the selling price by Rs. 10 per plate, 10 more plates are sold. FS incurs a cost of Rs. 120 per plate of biriyani, and has decided that the selling price will never be less than the cost price. Moreover, due to capacity constraints, more than 400 plates cannot be produced in a day.
If the selling price on any given day is the same for all the plates and can only be a multiple of Rs. 10, then what is the maximum profit that FS can achieve in a day?- XAT - 2024
- Profit and Loss
- A local restaurant has 16 vegetarian items and 9 non-vegetarian items in their menu. Some items contain gluten, while the rest are gluten-free.
One evening, Rohit and his friends went to the restaurant. They planned to choose two different vegetarian items and three different non-vegetarian items from the entire menu. Later, Bela and her friends also went to the same restaurant: they planned to choose two different vegetarian items and one non-vegetarian item only from the gluten-free options. The number of item combinations that Rohit and his friends could choose from, given their plan, was 12 times the number of item combinations that Bela and her friends could choose from, given their plan.
How many menu items contain gluten?- XAT - 2024
- permutations and combinations
- Which of the following Indian states does the River Ganges not flow through?
- XAT - 2024
- Static GK
- What is X-37B?
- XAT - 2024
- Scientific Developments
- Which of the following years is NOT a leap year?
- XAT - 2024
- Static GK
View More Questions


